
With higher land costs, increasing our yields is becoming key to reducing our costs of producing forage, and remaining competitive with corn and soybeans for acreage. Three factors limiting our forage yields are old stands, poor establishment and low soil fertility. Good soil fertility is essential to both yield and persistence of forage crops. Phosphorus (P) and potassium (K) fertility management is often overlooked, but is fundamental to producing forage to feed livestock and being competitive in today’s forage market.
Soil Testing
Soil testing and knowing how much P and K are available in the soil to start with is critical. Take a representative soil sample, send it to an accredited lab and use the results to determine optimum fertilizer rates. Keep records. Monitor whether fertility is increasing, decreasing or staying in an optimum range over time. Soil samples should be taken at least every 3 years. The time and effort it takes to do the soil sampling seems to be an obstacle, but with the cost of fertilizer there is likely no greater potential return on the cost and extra effort. Compare your fertilizer bill with the lab and mailing costs plus an incentive for the kids to do the sampling for you! Refer to OMAFRA Factsheet 06-031 “Soil Sampling & Analysis” www.omafra.gov.on.ca/english/engineer/facts/06-031.htm .
Relationship Between Soil Test & Forage Yield
When you get your soil test report, check the sodium bicarbonate phosphorus (P) and ammonium acetate potassium (K) soil test levels (ppm). (Use only these tests, as other tests (Bray or Mehlich) cannot be interpreted using Ontario calibration data.) How do your P and K soil test levels look?
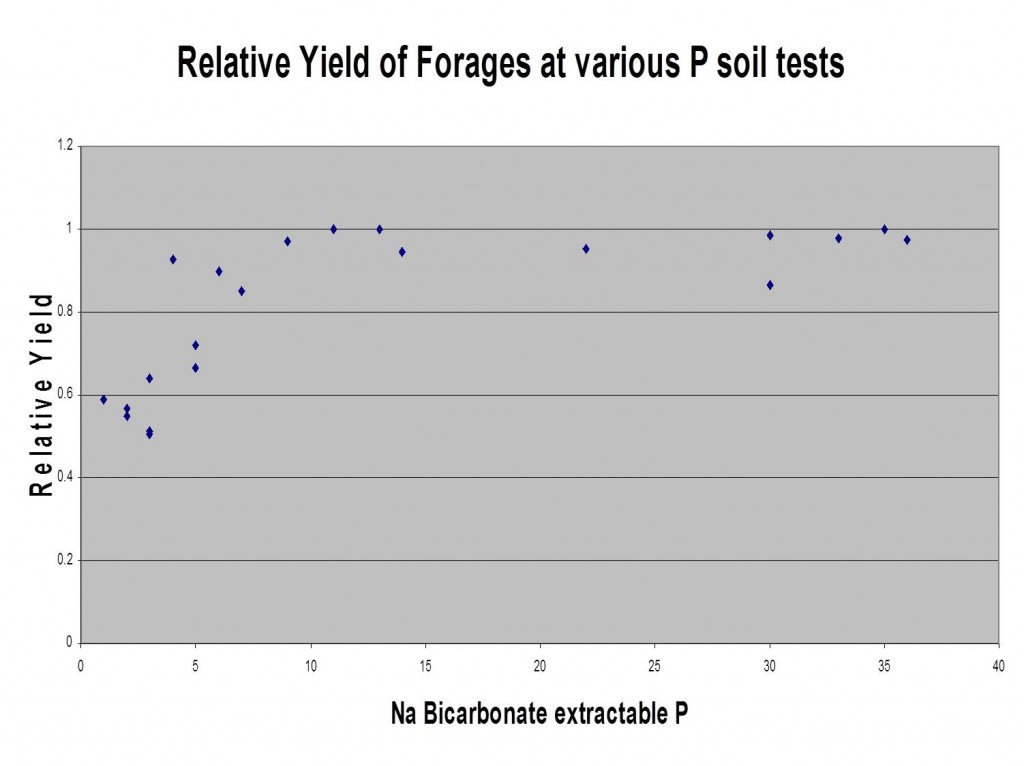
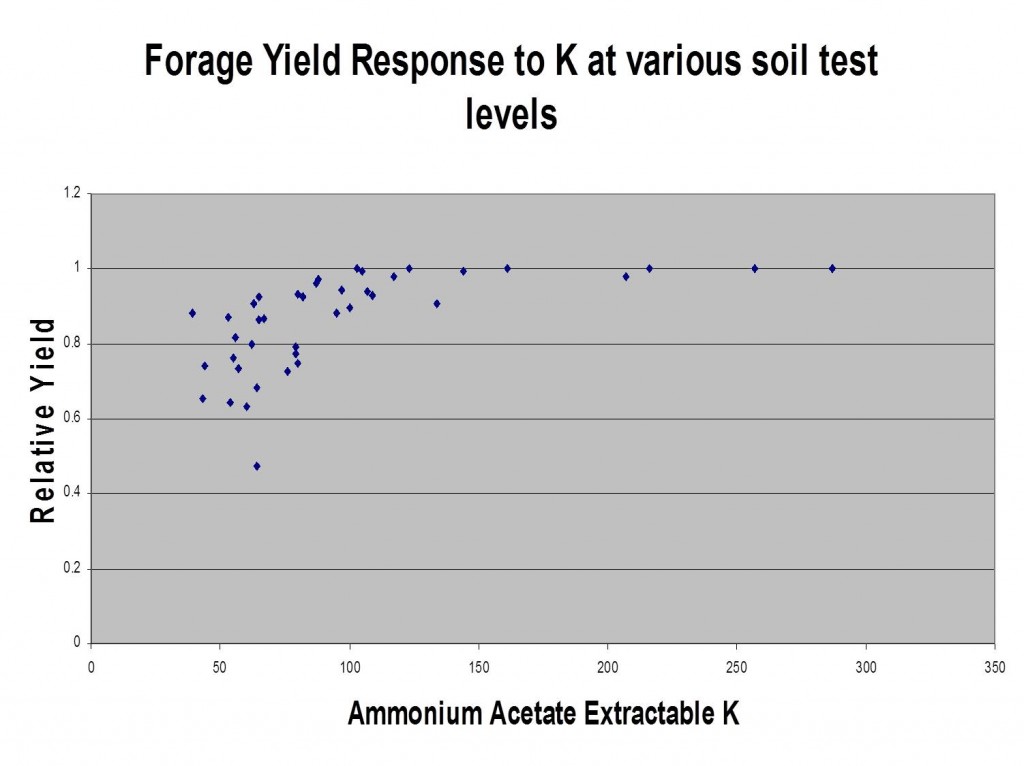
Research shows that the yield loss of alfalfa is significant when P soil test levels are much below 12 ppm (Figure 1) and K soil tests are below 120 ppm (Figure 2). The yield curves at low soil test levels are steep. A positive yield response from applying fertilizer will be seen when soil tests are below these optimum levels. On the flip side, the yield curve at high soil fertility levels is flat. Don’t expect any extra yield from applying fertilizer once the soil test have been built up to higher levels. In these cases, you can choose to apply fertilizer to replace the nutrients removed by the crop to prevent future nutrient deficiencies, but don’t expect extra yield from that maintenance application.
Crop Removal Of P and K
Forage crops remove a lot of nutrients and therefore have high soil nutrient requirements. With an alfalfa-grass mixture, a typical amount of P and K removed per tonne of hay harvested is equivalent to about 13.5 lbs (6.1 kg) of P205 and 54 lbs (24.6 kg) of K2O. As an example, assuming a mixed stand with a modest yield of 3.2 tonnes per acre per year, hay will remove about 43 lbs (20 kg) of P205 and 173 lbs (78 kg) of K2O every year.
Unlike nitrogen, forage crops cannot generate P or K out of thin air. Without replacing P and K with manure or commercial fertilizer, the soil tests will drop quickly. Forage fertility needs to be managed within the life of the stand. Let’s assume that it takes about 35 lbs/ac of P205 and 20 lbs/ac of K2O to move the soil tests by 1 ppm on some soils (these amounts will vary according to soil type and conditions). After only 4 years of harvesting forage without applying fertilizer, the P soil test could drop by 5 ppm and the K by 35 ppm. If the soil tests drop below the optimum levelsduring the life of the stand, this will significantly reduce forage yields. We also need to maintain soil nutrient levels for the next crops in the rotation. At lower soil test levels, this “soil mining” is not acceptable. Yet it goes on in many hay fields every year.
There is a wide range of soil fertility levels found in hay fields across the province. Dairy farms that apply a lot of manure typically have higher P and K levels. However, K deficiency has become more common, even on some dairy farms! Hay fields that are infrequently (or never) rotated and seldom (or never) receive manure or commercial fertilizer, are typically very low in soil fertility and yield. In a soil fertility survey by the East-Central SCIA, 30% of the fields tested were below 10 ppm P205, while an astounding 81% of fields were below 100 ppm K2O! In an alfalfa tissue test survey done in Ontario in 2012, 37% of the samples were below the critical level of 1.7% K, indicating a deficiency of soil K.
Sufficiency Approach
Tables 1 and 2 provide the OMAFRA P and K recommendations on established forage stands. These recommendations use the “sufficiency approach” to supply the optimum needs of the current crop by giving the greatest short term (1 year) net returns to fertilizer.
Build Up & Maintenance Approach
A longer term method also used to determine fertilizer application rates is the “buildup and maintenance approach”. This starts by determining the amount of nutrient removal of the crop (approximately 13.5 lbs of P205 and 54 lbs of K2O per ton of hay). It adjusts this by an amount required to increase (or decrease) the soil test levels (example – 35 lbs/ac of P205 and 20 lbs/ac of K2O to move the soil tests by 1 ppm) to targeted optimum levels (12 ppm P and 120 ppm K), amortized over several years. Applying nutrients to soils that test much above these critical levels (12 ppm P and 120 ppm K) rarely results in a profitable response. Refer to OMAFRA Publication 611, Soil Fertility Handbook (http://www.omafra.gov.on.ca/english/crops/pub611/p611order.htm ).
Other Recommendations
If manure is applied, reduce the fertilizer application according to the amount of P and K in the manure. For P and K recommendations at seeding (banded or not, with or without a nurse crop), or information on nitrogen rates, pH, manure application, sulfur and micronutrients (boron), refer to the Forage Fertility section of OMAFRA Publication 811, Agronomy Guide. www.omafra.gov.on.ca/english/crops/pub811/3fertility.htm .
Table 1 – Phosphate Recommendations For Established Forage Stand (Based on OMAFRA-Accredited Soil Tests)
Sodium Bicarbonate Phosporus Soil Test (ppm)
|
Established Forage Stand |
||
|
Rating 1
|
Phospate (P2O5) Required kg/ha |
|
|
0 – 3 |
HR |
180 |
|
4 – 5 |
120 |
|
|
6 – 7 |
90 |
|
|
8 – 9 |
60 |
|
|
10 – 12 |
MR |
30 |
|
13 – 15 |
20 |
|
|
16 – 20 |
LR |
0 |
|
21 – 25 |
0 |
|
|
26 – 60 |
RR |
0 |
|
61 + |
NR |
0 |
1 HR, MR, LR, RR & NR denote respectively – high, medium, low, rare and no probabilities of profitable crop response to applied nutrient. Profitable response to applied nutrients occurs when the increase in crop value from increased yield is greater than the cost of the applied nutrient.
Table 2 – Potash Recommendations For Established Forage Stand (Based on OMAFRA-Accredited Soil Tests)
Ammonium Acetate Potassium Soil Test (ppm)
|
Established Forage Stand |
||
|
Rating 1
|
Potash (K2O) Required kg/ha |
|
|
0 – 15 |
HR |
480 |
|
16 – 30 |
400 |
|
|
31 – 45 |
320 |
|
|
46 – 60 |
270 |
|
|
61 – 80 |
200 |
|
|
81 – 100 |
130 |
|
|
101 – 120 |
MR |
70 |
|
121 – 150 |
20 |
|
|
151 – 180 |
LR |
0 |
|
181 – 250 |
RR |
0 |
|
251 + |
NR |
0 |
1 HR, MR, LR, RR & NR denote respectively – high, medium, low, rare and no probabilities of profitable crop response to applied nutrient. Profitable response to applied nutrients occurs when the increase in crop value from increased yield is greater than the cost of the applied nutrient.