Crop yields have increased significantly since fertility recommendations were developed in Ontario. Crop nutrient uptake and grain nutrient removal have increased proportionately. A study was initiated in 2011 with funding from the Grain Farmers of Ontario to evaluate a corn-soybean-wheat rotation on four sites with relatively low soil test P and K levels. Areas within each test site were built to moderate P, moderate K, and moderate P and K soil test levels (P>20 ppm, K>120 ppm). High rates of P and/or K fertilizer were applied during the first few years of the study to build these areas. These built P and K soils can now be compared to soils with low background fertility. This project will test if current P and K recommendations ensure the most economic yields in high yield environments. Ontario recommendations are based on the “sufficiency approach” which aims to supply enough fertilizer for a given crop with the most economic rate of fertilizer for the year of application. Another approach to fertilizer application is the “build and maintain” approach which aims to build or draw down soil tests to a reasonable level and maintain soil tests at those levels. These two approaches to fertilization will also be compared.
Methods
Fertilizer was broadcast at high rates across specific blocks in every year to build up fertility (400 lbs/ac of product). One block was built with only P, another only K, and a third had both P and K built. An untreated block with low background fertility was left untreated at each site. All blocks and starter treatments were replicated 4 times whenever possible. The highest starter treatment rates were 50 lbs/ac of actual P and 50 lbs/ac of actual K. These starter rates were chosen to supply the approximate rates of recommended fertilizer under the “sufficiency approach”. Soil test values have now been built to moderate levels in those blocks that received fertilizer to the desired levels (P>20, K>120). Yield data from the next three growing seasons (2017, 2018, and 2019) will give the best comparison of the “sufficiency” approach to the “build and maintain” approach since previous years may have been influenced by the build-up phase of the experiment. Tables 1 to 3 present the most up to date yield results based on the last 3 growing seasons.
Results
Corn yields responded to a starter blend of P and K in low background fertility levels (P<20, K<120) by 30 bu/ac across the 17 site-years of this study. On “built” soils (P>20, K>120) corn responded to a P and K starter by 10 bu/ac (Table 1). The highest corn yields were achieved with a built soil test value plus a starter fertilizer containing P or a starter containing a blend of P and K. Averaged across background fertility, liquid starter added 9 bu/ac, dry P added 12 bu/ac, K added 13 bu/ac, and the P and K together added 22 bu/ac compared to no starter fertilizer. This study supports earlier findings that corn is highly responsive to starter fertilizers especially when soil test levels are low. It also demonstrates that even when soils are built starter fertilizers are still necessary to maximize yields. Most notably corn yields were 13 bu/ac higher on built soils compared to low background fertility even when a high rate of P and K starter was applied.
Table 1: Corn Yield Response to Background Fertility and Starter Fertilizer [17 site-years]
| Starter (per ac) | Background treatment | Average across background | |||
| P<20 K<120 | P>20 K<120 | P<20 K>120 | P>20 K>120 | ||
| Bu/ac | |||||
| No fertilizer | 157 d | 163 c | 174 c | 190 c | 171 d |
| 6-24-6 @ 3-5 gal in furrow | 170 c | 177 b | 179 b | 194 b | 180 c |
| MAP @ 100 lbs (2×2) | 172 bc | 174 b | 188 a | 198 ab | 183 b |
| 0-0-60 @ 80 lbs (2×2) | 175 b | 192 a | 174 c | 195 b | 184 b |
| 6-28-28 @ 90-270 lbs (2×2) | 187 a | 195 a | 190 a | 200 a | 193 a |
Means followed by the same letter are not statistically different within a column at P=0.05.
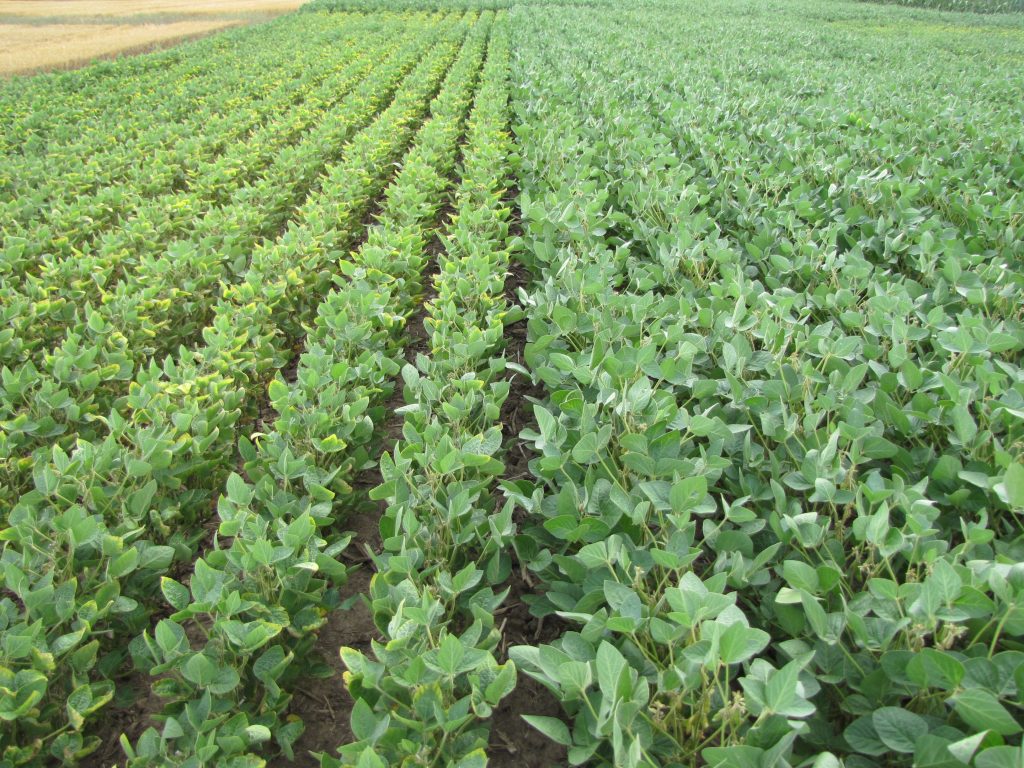
Soybean yields responded to a starter blend of P and K in low background fertility soils (P<20, K<120) by 4 bu/ac across the 17 site-years of this study. On “built” soils (P>20, K>120) soybeans did not respond to any starter fertilizer treatment. The highest soybean yields were achieved with a built soil test value. Averaged across background fertility, liquid starter added 1 bu/ac, dry P added 2 bu/ac, K added 1 bu/ac, and the P and K together added 3 bu/ac compared to no starter fertilizer. On low background fertility soils, liquid starter added 2 bu/ac, dry P added 2 bu/ac, K added 1 bu/ac, and a blend of P and K added 4 bu/ac compared to no starter fertilizer (Table 2). This study supports earlier findings that soybeans respond to starter fertilizers when soil test levels are low. This study has shown that K by itself is not sufficient to maximize soybean yields, P is also critical. This study also supports earlier findings that when soils are built starter fertilizers do not add yield to soybeans. Soybean yields were 4 bu/ac higher on built soils compared to low background fertility even when a high rate of P and K starter was applied.
Table 2. Soybean Yield Response to Background Fertility and Starter Fertilizer [17 site-years]
| Starter (per ac) | Background treatment | Average across background | |||
| P<20 K<120 | P>20 K<120 | P<20 K>120 | P>20 K>120 | ||
| Bu/ac | |||||
| No starter | 53 c | 55 b | 55 c | 60 a | 56 d |
| 6-24-6 @ 3 gal in furrow | 55 b | 56 b | 56 b | 61 a | 57 c |
| MAP @ 100 lbs (2×2) | 55 b | 56 b | 58 a | 61 a | 58 b |
| 0-0-60 @ 80 lbs (2×2) | 54 b | 58 a | 54 c | 60 a | 57 c |
| 6-28-28 @ 90-180 lbs (2×2) | 57 a | 59 a | 58 a | 61 a | 59 a |
Means followed by the same letter are not statistically different within a column at P=0.05.
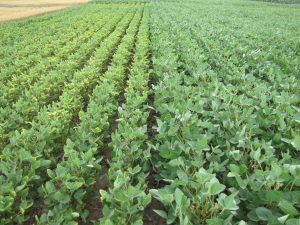
Figure 1. Severe K deficiency (left) in soybeans.
Winter wheat yields responded to a starter blend of P and K in low background fertility levels (P<20, K<120) by 14 bu/ac across the 13 site-years of this study. Wheat showed the same response to a P only starter on low background fertility soils (14 bu/ac). On “built” soils (P>20, K>120) wheat did not show a statistical yield response to any starter fertilizer over the untreated although the P only starter did provide a 4 bu/ac numerical advantage over the untreated (Table 3). Averaged across background fertility, liquid starter added 4 bu/ac, dry P added 10 bu/ac, K provided no additional yield, and a blend of P and K together added 10 bu/ac compared to no starter fertilizer. This study found that wheat is responsive to starter fertilizers especially when soil test levels are low. It also demonstrates that winter wheat is highly responsive to starter P. Most notably wheat yields were 11 bu/ac higher on built soils compared to low background fertility even when a high rate of P and K starter was applied.
Table 3. Wheat Yield Response to Background Fertility and Starter Fertilizer [13 site-years]
| Starter In-furrow (per ac) | Background treatment | Average across background | |||
| P<20 K<120 | P>20 K<120 | P<20 K>120 | P>20 K>120 | ||
| Bu/ac | |||||
| No fertilizer | 66 c | 83 c | 69 c | 88 ab | 76 c |
| 6-24-6 @ 3-5 gal | 72 b | 85 bc | 75 b | 89 ab | 80 b |
| MAP @ 80-100 lbs | 80 a | 88 ab | 85 a | 92 a | 86 a |
| 0-0-60 @ 70-80 lbs | 69 c | 88 ab | 69 c | 86 b | 78 bc |
| 6-28-28 @ 90-225 lbs | 80 a | 90 a | 84 a | 91 a | 86 a |
Means followed by the same letter are not statistically different within a column at P=0.05
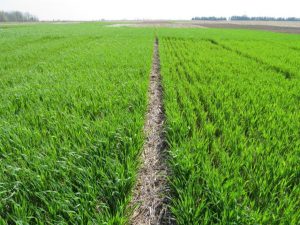
Figure 2. Wheat on the left had phosphorous (11-52-0) applied and on the right had potassium (0-0-60) applied, demonstrating the importance of P in wheat production.
Conclusion and Next Steps
On most crops and field site locations, starter fertilizers increased yields compared to no fertilizer, especially in wheat and corn and on soybeans when soil P and K levels were low. The highest yields tended to be produced from plots with moderate background P and K (broadcast P and K) in conjunction with a starter. Soybeans did not show a response to starter fertilizer on soils with higher background fertility. Now that specific plots have been built to moderate levels of P and K, and other plots have relatively low soil test P and K levels, fertilizer management strategies may be tested (the “sufficiency” versus the “build and maintain” approach). Yields to date show that building the soil adds 13 bu/ac of corn, 4 bu/ac of soybeans, and 11 bu/ac of wheat compared to fertilizing the crop under the present rates of the sufficiency approach. It is crucial that this experiment be continued for at least 3 additional years to get the most robust comparison of the two systems. An economic analysis will be conducted at the end of this study to determine which approach is the most economical way to grow crops in Ontario.
Contributors to this project: D. Hooker, H. Bohner, P. Johnson, B. Rosser, G. Stewart, and K. Janovicek