The 2025 Ontario Corn Committee (OCC) hybrid performance trials are now available at GoCrops.ca (Link HERE). Over past decades, Ontario’s average corn yields have increased around 2 bu/ac/yr. Staying current with new and competitive yielding hybrids is important.
A key benefit of OCC trials is the ability to compare a large number of hybrids. These comparisons are replicated many times within and across locations and years. This can provide a general positioning of hybrids available in the marketplace and help identify or compare ones that may be of interest. On-farm or local hybrid comparison data can help ground truth how hybrids of interest perform in your own farm environment.
A few tools are available to assist in comparing hybrids in the performance trial report:
Printable PDF
Sometimes it’s hard to beat working with a paper copy. If this is your preference, the entire report or individual areas can be printed. From the corn home page, select “Read The PDF Report” (Fig. 1) to view the entire report. If you prefer to view or print tables from individual areas, select “See Performance Trial Information” at the corn home page, then select “Performance Trial Results”. Tables (“PDF”) for each area are listed (Fig. 2).
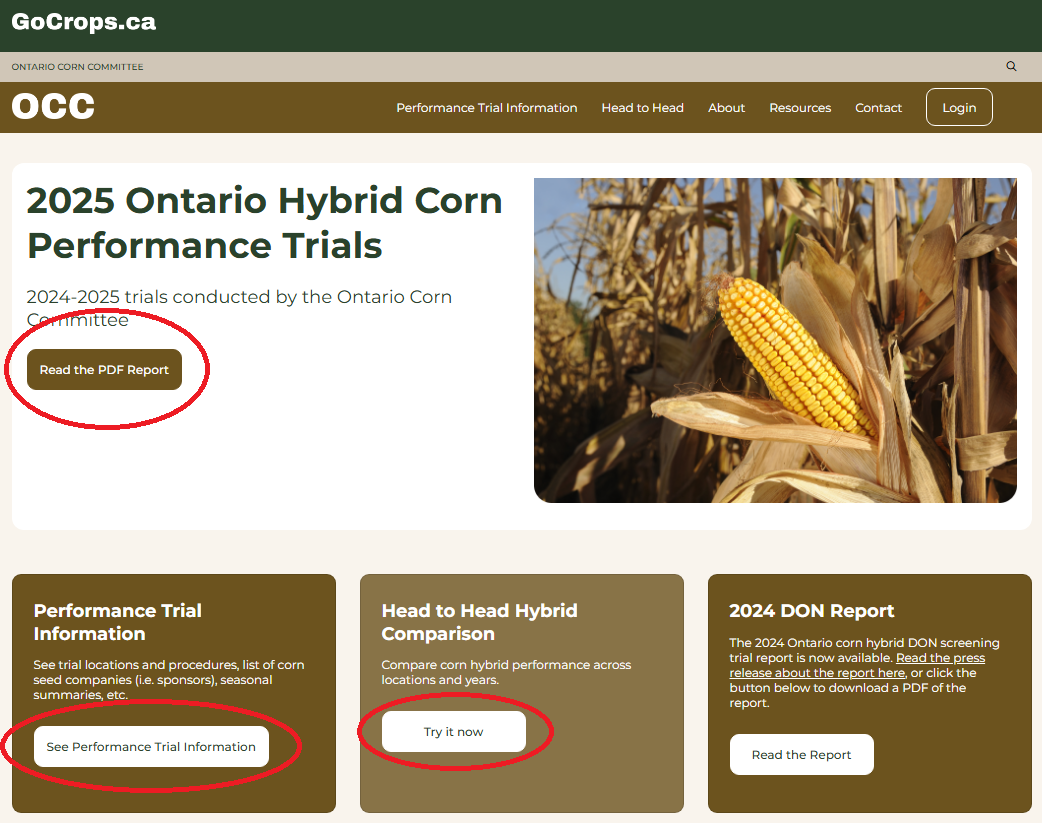
Figure 1. Ontario Corn Committee hybrid trial report page at corn section of gocrops.ca.
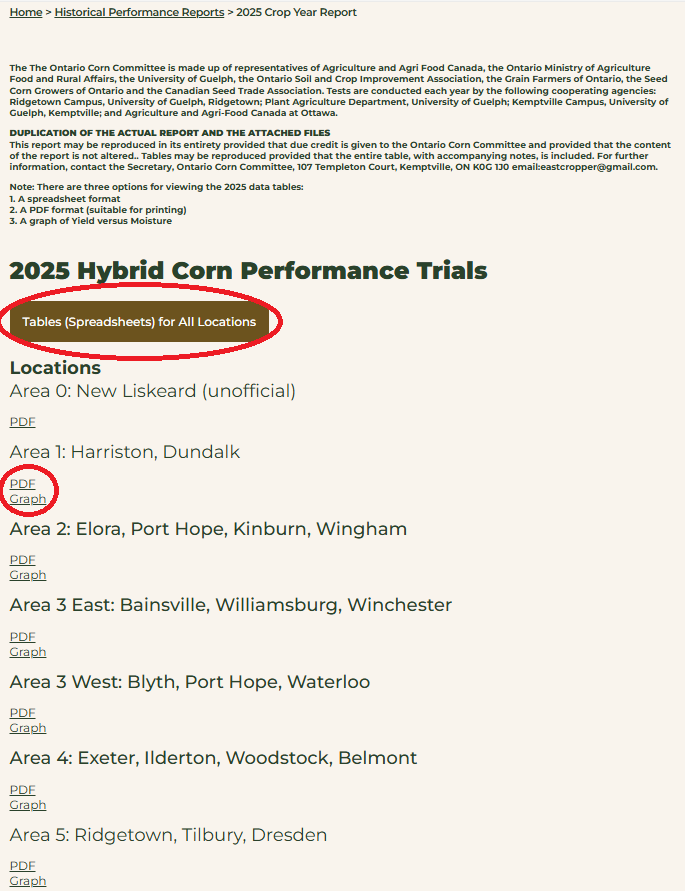
Figure 2. Spreadsheets, PDF tables and graphs for each area in 2025 in the historical performance reports section.
Sortable Spreadsheet
To access sortable spreadsheets, select the “See Performance Trial Information” box at the corn home page (Fig, 1), then select “Performance Trial Results”. Spreadsheets for each area can be viewed by selecting “Tables (Spreadsheets) for All Locations” (Fig. 2).
Spreadsheets allow you to sort hybrids by heat units, brand or hybrid name, or to rank hybrids by yield, moisture, lodging or test weight. Rankings can be made across multiple locations or years, or within individual locations (Fig. 3).
Multi-year and location data provides more stable indications of hybrid performance than single year or location data. With turnover of hybrids tested, multi-year data may not always be available.
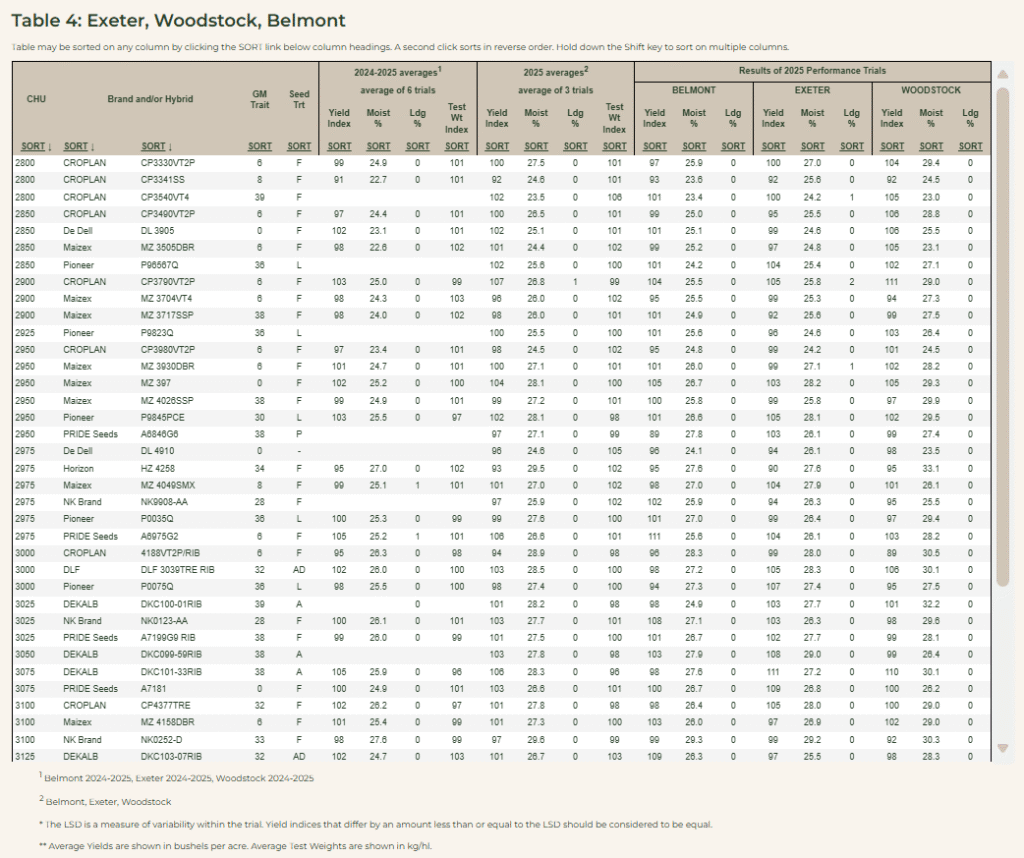
Figure 3. Area 4 sorted by CHU for all hybrids present in 2025.
Yield x Moisture Graphs
To access yield x moisture graphs, select the “See Performance Trial Information” box at the corn home page (Fig, 1), then select “Performance Trial Results”. Graphs for each area can be viewed by selecting “Graph” beneath each of the areas (Fig. 2).
These graphs visualize the relationship between yield and harvest moisture of hybrids within each OCC area and allow quick comparisons of hybrids within similar yield or moisture levels.
The lines of best fit on these graphs indicate the general trade-off between yield and moisture for the hybrids tested at each area and can be helpful for answering questions such as “what is the yield benefit and moisture penalty for extending hybrid maturity?”. As an example, in Figure 4, the average yield gain per point of harvest moisture in Area 2 over 2024 and 2025 is about 7 bu/ac.
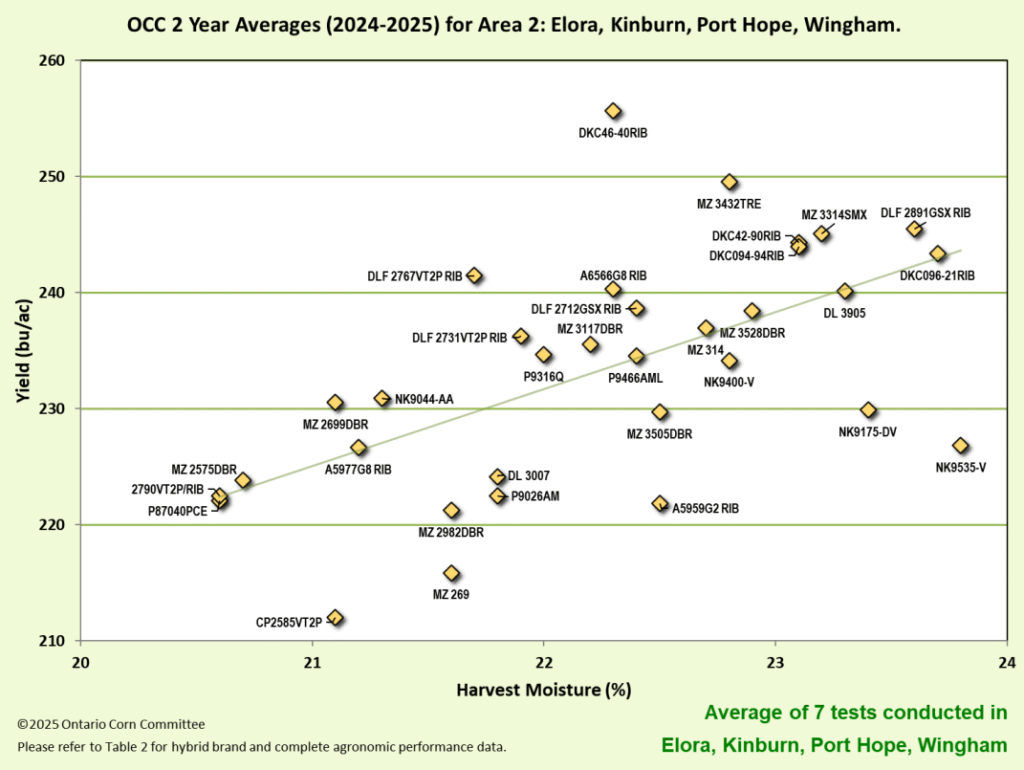
Figure 4. Yield by harvest moisture graph for Area 2, 2024-2025.
Head-to-Head Hybrid Comparison Tool
The head-to-head hybrid comparison tool can be accessed at the corn home page of gocrops.ca (Fig. 5) and allows head-to-head comparisons of up to 4 hybrids across years and locations where all selected hybrids were present at the same time. This can provide comparisons across more years than the PDF or spreadsheet tools. This tool also includes the ability to make economic comparisons of selected hybrids by entering expected corn price and expected seed and drying costs (Fig. 6).
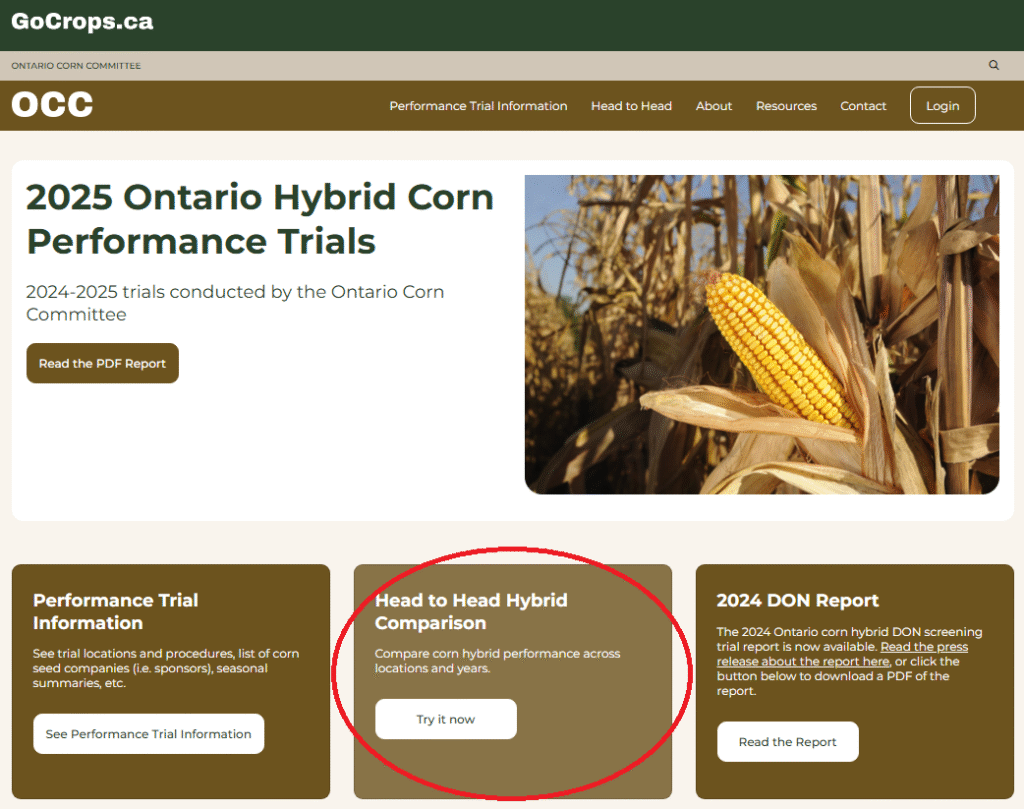
Figure 5. Hybrid Selector tool under “Interactive Tools” at gocorn.net home page.
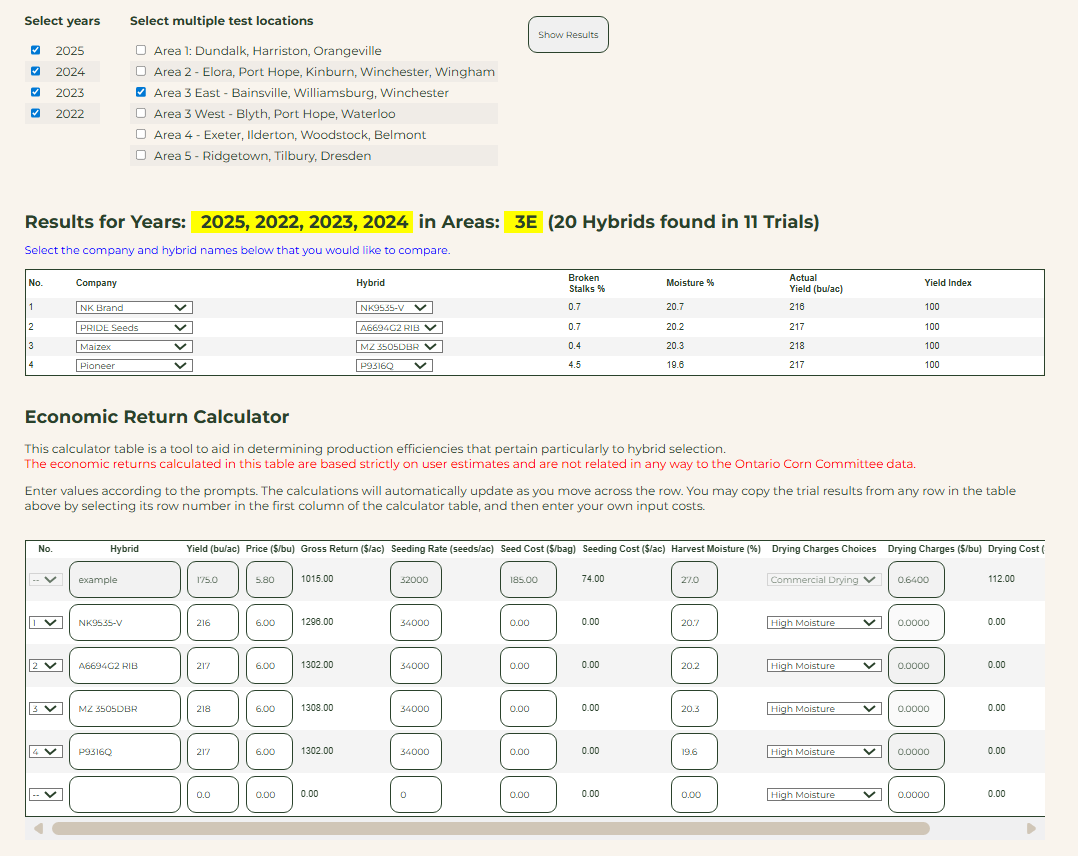
Figure 6. Head-to-head hybrid performance and economic comparisons using hybrid selector tool.
Optional reading that may help with interpretation of hybrid trial results
Yield Indexes
Because performance data is pooled across many locations and years, yields (and test weights) are reported as indexes.
The yield index is the hybrid yield relative to the average of that location or summary. If a hybrid yields the same as average, it’s yield index would be 100. If a hybrid yields 4% higher than average, it’s yield index would be 104. If a hybrid yields 4% lower than average, it’s yield index would be 96. Indexes are shown because actual yield differences between hybrids may vary depending on yield potential of the environment.
Index can be converted to yield. Divide index by 100 and multiply by the trial average. For example, at a trial averaging 200 bu/ac, a hybrid with yield index of 104 would yield 208 bu/ac while a hybrid with yield index of 96 would yield 192 bu/ac.
LSD
When comparing hybrids, watch the LSD (Least Significant Difference) at the bottom of the table. This is the difference in yield index required to be highly confident differences between hybrids are truly due to the hybrids and not just background variability at the trials.
For example, if LSD was 4, and:
– Hybrid A had a yield index of 100 and hybrid B had a yield index of 106, it’s highly likely hybrid B was truly higher yielding than A (yield index difference of 6 is greater than LSD of 4). Very low probability background variability caused this much difference.
– Hybrid A had a yield index of 100 and hybrid B had a yield index of 102, we can’t be confident hybrid B was truly higher yielding than A (yield index difference of 2 is less than LSD of 4). There is a high probability that background variability at this trial could also have produced this yield difference.