Growing Degree Days
Growing degree days (GDD), an estimate of accumulated heat, are used to predict the growth and development of plants, insects and diseases during the growing season. Insect, disease and plant development are very dependent on temperature and the daily accumulation of heat. The amount of heat required to advance a plant or pest to the next development stage remains constant from year to year, however, the actual amount of time (days) can vary considerably because of weather conditions.
Each crop, insect and disease species has a minimum base temperature or threshold below which development does not occur. These base temperatures have been determined experimentally and are different for each organism. GDD information can be very useful for predicting plant, insect and disease development. Some Ontario crops still use the GDD system while others have moved to the Ontario Crop Heat Unit (CHU) system described in the next section. Field crops that use the GDD system are cereals which have a Base: 0 (plant development occurs at 0°C or higher), and alfalfa and canola which have a Base: 5 (plant development occurs at 5°C or higher). To calculate GDD, first determine the mean temperature for the day. This is usually done by taking the maximum and minimum temperatures for the day, adding them together and dividing by two. The base temperature is then subtracted from the mean temperature to give a daily GDD. If the daily GDD calculates to a negative number, it is recorded as zero. Each daily GDD is then added up (accumulated) over the growing season.
GDD are sometimes referred to as “degree days” or the “degree days averaging method.” Some jurisdictions also use the term “heat units” interchangeably with “degree days.” In Ontario, the terms “growing degree days” (GDD) and “crop heat units” (CHU) are used independently since they represent two very different, temperature-dependent, development models.
Growing Degree Day Equation:
The GDD equation used by OMAFRA is calculated as follows:
Daily GDD = ((T max + T min) ÷ 2) – T base
T max = the daily maximum air temperature
T min = the daily minimum air temperature
T base = the GDD base temperature for the organism being monitored
Example:
Maximum Temperature: 28°C
Minimum Temperature: 15°C
Pest: European corn borer (ECB)
Base Temperature for ECB:10°C
Calculation:
Daily GDD = ((28 + 15) ÷ 2) – 10 = 11.5
Therefore: 11.5 GDDs were accumulated for that day for the European corn borer GDD model.
There are four factors to consider when comparing GDD accumulations from various sources or regions.
- Are the base temperatures used in the equations the same?
Different organisms have different base temperatures used to calculate GDD: 150 GDD at Base 10 does not equal 150 GDD at Base 0. - Are the start dates for the accumulations the same?
Generally, GDD accumulations start on April 1 each year, but some insect GDD models start at the emergence of a specific life stage. This is referred to as a biofix. - Are the equations used to calculate the daily GDD the same?
Many modifications to the simple GDD calculation have been developed over the years and may be referred to generally as degree days. - Are the temperatures used in degrees Celsius or Fahrenheit?
GDD accumulations will vary significantly, depending on whether they are being tracked in Celsius or Fahrenheit. GDD models have been designed specifically for use in one or the other and cannot be interchanged without making conversions. The ECB GDD model was based on measurements in Celsius.
Crop Heat Units (CHU)
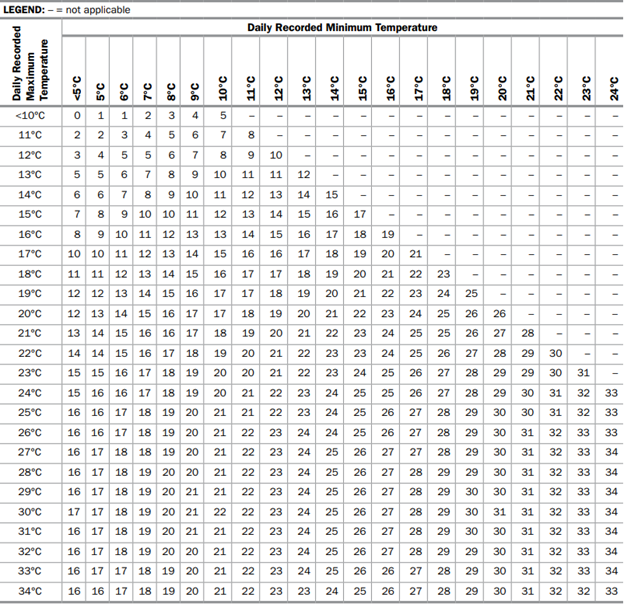
Crop Heat Units (CHU) are based on a principle similar to GDD. CHU accumulations are calculated on a daily basis, using the maximum and minimum temperatures, however, the equation that is used is quite different. The CHU model uses separate calculations for maximum and minimum temperatures. The maximum or daytime relationship uses 10°C as the base temperature and 30°C as the ceiling, because warm-season crops do not develop at all when daytime temperatures fall below 10°C and develop fastest at about 30°C. The minimum or nighttime relationship uses 4.4°C as the base temperature and does not specify an optimum temperature, because nighttime minimum temperatures very seldom exceed 25°C in Ontario. The nighttime relationship is considered a linear relationship, while the daytime relationship is considered non-linear because crop development peaks at 30°C and begins to decline at higher temperatures. Daily CHU are calculated by using the average of the two daily values from the equations below or can be read from the matrix in Table 10–4, Daily crop heat unit accumulations based on maximum and minimum temperatures.
Producers who record high and low temperatures can use Table 10–4, Daily crop heat unit accumulations based on maximum and minimum temperatures, to calculate CHU accumulations for their own farm. CHU accumulations are recorded from May 1st at all locations and end with the first occurrence of -2°C in the fall. Corn development is driven primarily by temperature, and this is especially true during the planting-to-silking period. Unlike soybeans, day length has little effect on the rate at which corn develops. The Ontario CHU system has been developed to calculate the impact of temperature on corn development.
CHU accumulation affects soybeans differently than corn. Soybeans, a warm-season crop, are more susceptible to cold temperatures, especially during flowering. It is believed that sustained cold temperatures (less than 10°C) during flowering affect proper formation of pollen in the flower. Sustained cold temperatures result in poorly developed pods called parthenocarpic pods (also called “monkey pods”). There is some variety difference in tolerance to cold temperatures.
Table 10–4. Daily crop heat unit accumulations based on maximum and minimum temperatures
Calculating Daily CHU
The following equation is used to calculate a daily CHU for a site:
Daily CHU = (Y max + Y min) ÷ 2 where:
Y max = (3.33 x (T max–10)) – (0.084 x (T max–10)2) (If values are negative, set to 0) T max = Daily maximum air temperature (°C) (measured from midnight to midnight) (Accuracy should be <0.25°C)
Y min = (1.8 x (T min – 4.4))
(If values are negative, set to 0)
T min = Daily minimum temperature (°C)
Mapping Tools
Farm and field maps can support and enhance observations made in the field. Field sketches that use aerial photographs as a base are often used in nutrient management planning. Site-specific soil textures, tile drainage, elevation and aerial imaginary data are all available in maps, and often the information can be layered onto one map. This type of mapping is accessible online. Ontario Ag Maps (ontario.ca/agmaps) includes mapping tools to build customized maps of individual farms and fields. Figure 10-2, Example field map using Ontario Ag Maps, illustrates a farm property with topography and measured acres. Tile drainage and water runs, and areas where ponding occurs are evident and can indicate where additional scouting should occur or act as a record-keeping tool to illustrate the impact of changes.
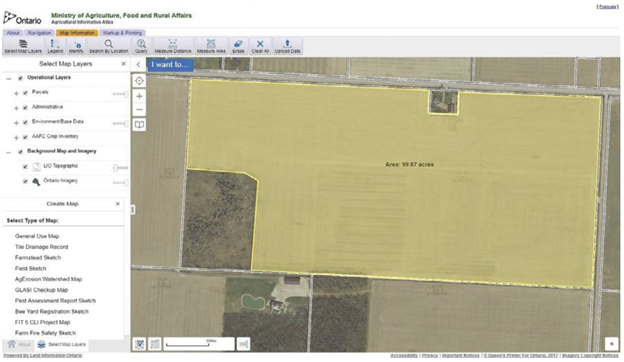
Figure 10–2. Example field map using Ontario Ag Maps (ontario.ca/agmaps).