Nitrogen
Cereals are members of the grass family and are very responsive to nitrogen. Over-application of nitrogen causes lodging in cereal crops, resulting in reduced yield, quality and harvestability. See Photo 4-2. The optimum rate of nitrogen for a particular field will depend on the crop being grown, past applications of manure or fertilizer to the field, soil type crop rotation and weather. Use general guidelines as a starting point but combine them with observations of crop growth and lodging tendency.
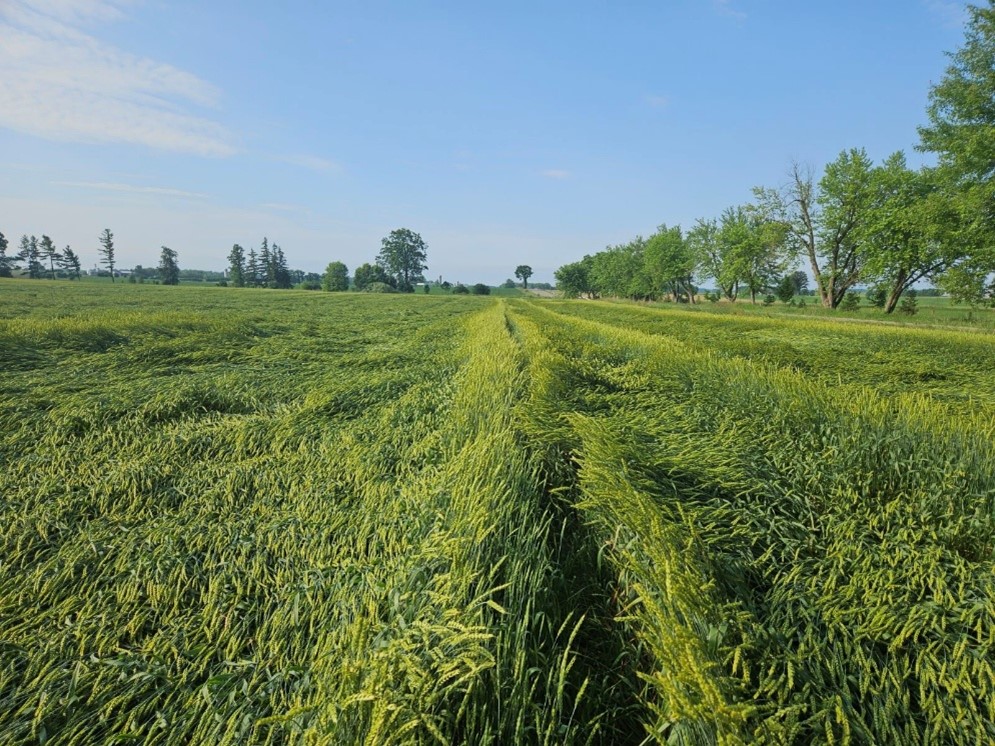
Photo 4-2. Lodging due to overlaps and/or excessive rates of nitrogen fertilizer
The interaction of fungicides with nitrogen on winter wheat will also impact nitrogen application guidelines. See Figure 4–6, Nitrogen response with and without fungicides. Value of the crop, price of nitrogen and cost of fungicides will all play a role in determining the maximum economic rate of nitrogen.
General Guidelines
General nitrogen fertilizer guidelines for cereal crops are given in Table 4–13, Nitrogen requirements for cereal crops, Table 4–14, Nitrogen requirements for pastry wheat and Table 4–17, Nitrogen guidelines for spring barley based on nitrate-nitrogen soil tests.
General nitrogen fertilizer guidelines for cereal crops are given in Table 4–13, Nitrogen requirements for cereal crops, Table 4–14, Nitrogen requirements for pastry wheat and Table 4–17, Nitrogen guidelines for spring barley based on nitrate-nitrogen soil tests.
Table 4-13. Nitrogen requirements for cereal crops1
| Crop | N Required1 |
| Barley (areas receiving 2,800 CHUs or less)2 | 70-90 kg/ha (63-81 lb/acre) |
| Barley (areas receiving more than 2,800 CHUs) | 45-60 kg/ha (40-54 lb/acre) |
| Cereals seeded as a nurse crop for forages | 15 kg/ha (14 lb/acre) |
| Mixed grain, spring triticale (S. Ontario) | 45-60 kg/ha (40-54 lb/acre) |
| Mixed grain, spring triticale (N. Ontario) | 70-90 kg/ha (63-81 lb/acre) |
| Oat, spring rye (S. Ontario) | 35-50 kg/ha (32-45 lb/acre) |
| Oat, spring rye (N. Ontario) | 55-75 kg/ha (50-68 lb/acre) |
| Spring wheat | 70-100 kg/ha (63-91 lb/acre) |
| Winter barley, winter rye3 | 90 kg/ha (81 lb/acre) |
| Winter triticale | 80 kg/ha (72 lb/acre) |
| Winter wheat | See Table 4-14 |
| 100 kg/ha = 90 lb/acre | |
| 1 Where manure is applied or the preceding crop is a legume sod, reduce the N rates as shown in Table 9–10. Adjustment of Nitrogen Requirement, Where Crops Containing Legumes Are Plowed Down, and Table 9–11. Typical Amounts of Total and Available Nitrogen, Phosphate and Potash from Various Organic Nutrient Sources 2 Nitrate-Nitrogen Soil Test for Spring Barley 3 When not in rotation with tobacco. | |
Table 4-14. Nitrogen requirements for pastry wheat1
| Nitrogen:Wheat Price Ratio | Expected Yield | ||||
| 4 t/ha (60 bu/acre) | 5 t/ha (75 bu/acre) | 6 t/ha (90 bu/acre) | 7 t/ha (105 bu/acre) | 8 t/ha (120 bu/acre) | |
| 5 | 75 kg N/ha | 95 kg N/ha | 110 kg N/ha | 125 kg N/ha | 140 kg N/ha |
| 6 | 70 kg N/ha | 85 kg N/ha | 105 kg N/ha | 120 kg N/ha | 135 kg N/ha |
| 7 | 65 kg N/ha | 80 kg N/ha | 100 kg N/ha | 115 kg N/ha | 130 kg N/ha |
| 8 | 60 kg N/ha | 75 kg N/ha | 95 kg N/ha | 110 kg N/ha | 125 kg N/ha |
| 100 kg/ha = 90 lb/acre | |||||
| 1The price ratio is the cost of the nitrogen(N) in the fertilizer ($/kg N) divided by the selling price of the wheat ($/kg of wheat). Price Ratio Example: Price of UAN is $350/T, price per kilogram of N is $350 ÷ 280 = $1.25/kg Wheat value at $250/T is $0.25/kg. Price ratio is $1.25 ÷ $0.25 = 5. It takes 5 kg of wheat to pay for 1 kg N | |||||
Table 4-15. Managing for increased protein
| Management Input | Protein Increase (%) |
| 35 kg/ha additional N | 0.5 |
| 70 kg/ha additional N | 1.0 |
| Split N (GS 30 + 32) | 0.5 |
| Post Anthesis N (GS 30 + 69) | 0.75 |
| Split N (GS 30 + 32 +69) | 1.0 |
| Agrotain Plus | 0.2 |
| ESN 50% | 0.5 |
| ESN 100% | 0.75 |
| Source: P. Johnson, S. McClure, 2008-2014 averages from research trials. | |
Hard Winter Wheats (Red and White)
The current recommended hard winter wheat varieties in Ontario are not equivalent to Canadian Western Red Spring Wheat (CWRS) but are mid-strength or blend varieties with bread-baking and other unique qualities. High protein content is required in these varieties to meet quality specifications. To achieve these protein levels, a higher rate of nitrogen fertilizer is often required. The optimum rate of nitrogen is in the range of 35–70 kg/ha (30–60 lb/acre) greater than for pastry (soft) wheat. Split nitrogen applications increase protein, but often these increases are small enough that the split application is not economical. Ontario research data indicates that split N applications increase yield by 0.5%, on average.
As N rates increase, density of the plant canopy increases which increases the risk of foliar diseases. Yield responses to increased N rates are not expected unless accompanied by adequate control of leaf and head diseases with fungicides. With the use of a T2 or T3 fungicide and where lodging has not been a concern, spring N application rate may be increased by 30 kg N/ha (27 lbs/acre).
Nitrogen for grain protein production is required later in the development of the plant than the nitrogen for yield. This makes hard wheat varieties ideally suited to use the nitrogen from slow-release nitrogen sources or organic sources (legume plowdown or livestock manure). Desired protein levels are often easier to achieve on livestock farms due to these factors. Similar to split nitrogen applications, research on Environmentally Stable Nitrogen (ESN) (poly coated urea, 44-0-0) has shown a 0.5% increase in protein when included at 50– 65% of the nitrogen applied as shown in Table 4-14, Managing for increased protein. There was no increase or decrease in yield with ESN in these studies.
Nitrate-Nitrogen Soil Test for Spring Barley
Application of fall nitrogen is discouraged under Ontario growing conditions. It brings no value to the producer and may be an environmental concern from nitrate reaching groundwater. While this practice is viable in other winter cereal growing regions, those regions have warmer winters that allow for some continued growth over the winter months. Due to snow cover and cold winter conditions, winter cereals become totally dormant In Ontario. Fall nitrogen is not taken up because there is no growth. Nitrogen is subject to leaching or denitrification over the wet conditions of late fall, winter, and early spring. Research shown in Table 4-16, Fall applied nitrogen, suggests that over 50% of the fall applied nitrogen is lost overwinter. With no benefit and potential environmental impact, fall nitrogen (other than the small amount that comes along with starter phosphorus) is strongly discouraged.
Table 4-16. Fall applied nitrogen
| Nitrogen Timing | Yield | Yield Impact1 |
| 100 kg/ha (90 lb/acre) spring | 5.53 t/ha (82.2 bu/acre) | 0 |
| 34 kg/ha (30 lb/acre) fall + 100 kg/ha (90 lb/acre) spring | 5.69 t/ha (84.6 bu/acre) | -0.26 t/ha (-3.8 bu/acre) |
| 135 kg/ha (120 lb/acre) spring | 5.94 t/ha (88.4 bu/acre) | 0 |
| 34 kg/ha (30 lb/acre) fall + 135 kg/ha (120 lb/acre) spring | 5.96 t/ha (88.7 bu/acre) | -0.16 t/ha (-2.4 bu/acre) |
| 168 kg/ha (150 lb/acre) spring | 6.13 t/ha (91.1 bu/acre) | 0 |
| Source: P. Johnson, S. McClure 2011-2013 (18 locations). | ||
| 1Yield compared to equal nitrogen all applied in spring. | ||
Since soils can vary greatly in their ability to supply nitrogen, the general guidelines found in Table 4–13, Nitrogen requirements for cereal crops, may not be the most profitable for some fields. The amount of nitrate-nitrogen present in the soil near planting time can be a useful indicator of a soil’s ability to supply nitrogen.
The nitrate-nitrogen soil test can be used to predict nitrogen requirements for spring barley in areas other than Eastern Ontario that receive less than 3,000 CHUs, see Figure 1–1, Crop heat units (CHU-M1) available for corn production.
Consider a guideline based on a spring nitrate-nitrogen test to be a useful indicator for formulating a nitrogen management program for spring barley, see Table 4–17, Nitrogen guidelines for spring barley based on nitrate-nitrogen soil tests.
Table 4-17. Nitrogen guidelines for spring barley based on nitrate-nitrogen soil tests
| For areas outside of eastern Ontario that receive less than 3,000 CHUs. | ||||
| Spring Soil Nitrate-Nitrogen 0-30 cm1 | Price Ratio2 | |||
| 8 | 7 | 6 | 5 | |
| 10 kg/ha | 138 kg/ha | 147 kg/ha | 156 kg/ha | 165 kg/ha |
| 20 kg/ha | 107 kg/ha | 114 kg/ha | 122 kg/ha | 129 kg/ha |
| 30 kg/ha | 76 kg/ha | 81 kg/ha | 87 kg/ha | 93 kg/ha |
| 40 kg/ha | 44 kg/ha | 49 kg/ha | 53 kg/ha | 57 kg/ha |
| 50 kg/ha | 13 kg/ha | 16 kg/ha | 18 kg/ha | 21 kg/ha |
| 60 kg/ha | 0 | 0 | 0 | 0 |
| 100 kg/ha = 90 lb/acre | ||||
| 1To convert to nitrate-nitrogen soil test (30-cm depth) for kg/ha to ppm, divide by 4. 2The price ratio is the cost of the nitrogen (N) in the fertilizer ($/kg N), divided by the selling price of the barley ($/kg of barley). Price Ratio Example: see Table 4-13. | ||||
Time and Depth of Sampling
Collect samples as close to planting time as practical (within 5 days of planting), allowing for sample shipping, analysis, and receipt of results. Contact the accredited lab to determine sample turnaround times.
It is important that all cores in a field be taken to a 30 cm (12 in.) depth. To ensure that the sample is representative of the field, take the same number of cores and use a sampling pattern similar to that recommended for the standard soil test described in Soil Sampling. Also refer to Appendix C, Accredited Soil-Testing Laboratories in Ontario.
Where Caution is Required
There are situations where the fertilizer recommendations based on nitrate-nitrogen soil tests should be adjusted. The nitrogen in manure or legumes applied or plowed down just before sampling will not have converted into nitrate and will not be detected by the soil test. Information will be provided with the soil test results on how to make appropriate adjustments.
Exercise caution if the recommendation is for large quantities of nitrogen and there is a history of barley lodging at lower rates of nitrogen. The nitrate-nitrogen soil test has not been adequately evaluated for:
- legumes or manure plowed down in the late summer or fall
- barley following legumes in a no-till system employing chemical burndown of the legumes
Uniformity of Nitrogen Fertilizer Application
To maximize yield, nitrogen must be applied uniformly across the field. Uniform application is more critical than the form of nitrogen fertilizer applied. Table 4–18, Yield loss associated with inaccurate nitrogen application patterns, indicates the potential yield loss associated with inaccurate spread patterns. A 1.48 t/ha (22 bu/acre) yield difference was found between the fully fertilized and under-fertilized strips in the field.
Table 4-18. Yield loss associated with inaccurate nitrogen application patterns
| Based on two locations in Middlesex County, 1998, three replications at each location. | |
| Application Pattern | Yield Loss |
| Low N | 3.72 t/ha (55.3 bu/acre) |
| Full N | 5.20 t/ha (77.3 bu/acre) |
| Source: P. Johnson, OMAFRA. | |
Urea-Ammonium Nitrate Solution (UAN) (28-0-0 or 32-0-0) applied with streamer nozzles gives excellent, uniform nitrogen application and has shown small yield advantages 0.17 t/ha (2.5 bu/acre) as shown in Table 4–19, UAN as a herbicide carrier. Urea or ammonium nitrate (calcium ammonium nitrate) can be applied using airflow technology, improving uniformity, although uniformity is not guaranteed. During humid days, urea can build up in the airflow tubes, restricting flow and affecting distribution. Be sure to maintain clear hoses to achieve a uniform spread pattern.
Table 4-19. UAN as an herbicide carrier
| Application Combination | Visual Injury | Yield |
| 200 L/ha water (18 gal/acre1 water) | 0% | 6.4 t/ha (95 bu/acre) |
| 150 L/ha water + 50 L/ha UAN (13.4 gal/acre water + 4.5 gal/acre UAN) | 3% | 6.4 t/ha (95 bu/acre) |
| 100 L/ha water + 100 L/ha UAN (9 gal/acre water +9 gal/acre UAN) | 5% | 6.1 t/ha (91 bu/acre) |
| 50 L/ha water + 150 L/ha UAN (4.5 gal/acre water + 13.4 gal/acre UAN) | 7% | 6.1 t/ha (91 bu/acre) |
| 200 L/ha UAN (18 gal/acre UAN) | 9% | 6.0 t/ha (89 bu/acre) |
| 1 1 gallon (Imperial) = 1.2 U.S gallon | ||
| Source: Sikkema, University of Guelph (RCAT), 2008-2013. | ||
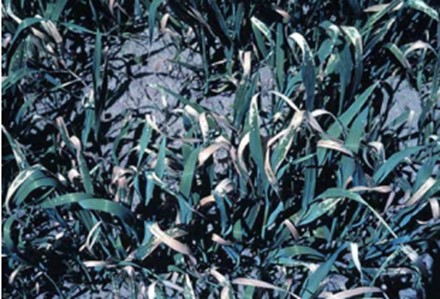
Photo 4-3. UAN 28% leaf burn. Applications of 28% nitrogen fertilizer can burn leaves and reduce yields.
Spinner spreaders often have the greatest inconsistency in spread pattern. If spinners are employed, consider double spreading the field at half the rate, i.e., 6 m (20 ft) centres instead of 12 m (40 ft) centres, to overcome this inconsistency. European style spinner spreaders, which can adjust the fertilizer drop onto the spinner, are much more accurate in spread pattern. However, until the fertilizer industry in Ontario advances as it has in Europe, with granule size and density for each load, this improved technology will be of limited value.
Pendulum spreaders have performed very well in accuracy tests with dry fertilizer. However, with small hoppers and narrow spread patterns, this type of spreader is not very common in Ontario.
UAN applied through streamer nozzles causes little or no leaf burn. Applying 28% nitrogen (UAN) as an overall broadcast treatment (using flood jet or tee-jet nozzles) to emerged cereal crops is NOT ADVISED. Table 4–18 shows the potential yield loss associated with this practice. The addition of 28% to a herbicide application, especially contact herbicides, will greatly increase leaf injury and yield loss. See photo 4-3.
A range of streamer nozzles exist for UAN application. Tests have shown that boom height can have a major impact on some nozzles. For example, three-stream nozzles work well at the correct 50 cm (20 in.) nozzle to target distance. However, if booms with three-stream nozzles vary in height due to rolling topography or rough field conditions, at 75 cm (30 in.) height their pattern is much less ideal. Chafer streamer bars give excellent uniformity, regardless of boom height: but nozzles can turn on the boom, and folding the boom with these large nozzle bodies can be problematic.
Timing of Nitrogen Application
Most nitrogen fertilizers for spring cereals are applied before planting and worked into the soil. This allows optimum crop utilization of the fertilizer, while minimizing the risk of losses through run-off or volatilization. It is acceptable to top-dress emerged spring cereals, particularly if a starter fertilizer has been applied at planting.
Phosphate and Potash
Phosphate and potash recommendations for cereals are in Table 4–20, Phosphate (P2O5) guidelines for cereals and Table 4-21, Potash (K2O) guidelines for cereals.
These fertilizer guidelines are based on OMAFRA-accredited soil tests. For information on the use of these tables, or if an OMAFRA-accredited soil test is unavailable, see Fertilizer Guidelines.
These fertilizer guidelines are based on OMAFRA-accredited soil tests. For information on the use of these tables, or if an OMAFRA-accredited soil test is unavailable, see Fertilizer Guidelines.
Table 4-20. Phosphate (P2O5) guidelines1 for cereals
| Based on OMAFRA-accredited soil tests. Profitable response to applied nutrients occurs when the increase in crop value, from increased yield or quality, is greater than the cost of the applied nutrient. Where manure is applied, reduce the fertilizer application according to the amount and quality of manure, see Manure section. LEGEND: HR = high response MR = medium response LR = low response RR = rare response NR = no response | ||||
| Sodium Bicarbonate Phosphorus Soil Test | Spring Barley, Spring Wheat, Mixed Grain | Oat, Spring Triticale, Spring Rye | Winter Wheat, Winter Rye, Winter Barley, Winter Triticale | Winter or Spring Grains Seeded Down |
| Phosphate Required1 | ||||
| 0–3 ppm | 110 kg/ha (HR) | 70 kg/ha (HR) | 70 kg/ha (HR) | 130 kg/ha (HR) |
| 4–5 ppm | 100 kg/ha (HR) | 60 kg/ha (HR) | 60 kg/ha (HR) | 110 kg/ha (HR) |
| 6–7 ppm | 90 kg/ha (HR) | 50 kg/ha (HR) | 50 kg/ha (HR) | 90 kg/ha (HR) |
| 8–9 ppm | 70 kg/ha (HR) | 30 kg/ha (HR) | 30 kg/ha (HR) | 70 kg/ha (HR) |
| 10–12 ppm | 50 kg/ha (MR) | 20 kg/ha (MR) | 20 kg/ha (MR) | 50 kg/ha (MR) |
| 13–15 ppm | 20 kg/ha (MR) | 20 kg/ha (MR) | 20 kg/ha (MR) | 30 kg/ha (MR) |
| 16–20 ppm | 20 kg/ha (MR) | 0 (LR) | 20 kg/ha (MR) | 20 kg/ha (MR) |
| 21–25 ppm | 0 (LR) | 0 (LR) | 20 kg/ha (MR) | 20 kg/ha (MR) |
| 26–30 ppm | 0 (LR) | 0 (LR) | 20 kg/ha (MR) | 20 kg/ha (LR)1 |
| 31–40 ppm | 0 (RR) | 0 (RR) | 0 (LR) | 0 (LR) |
| 41–50 ppm | 0 (RR) | 0 (RR) | 0 (RR) | 0 (RR) |
| 51–60 ppm | 0 (RR) | 0 (RR) | 0 (RR) | 0 (RR) |
| 61+ ppm | 0 (NR)2 | 0 (NR)2 | 0 (NR)2 | 0 (NR)2 |
| 100 kg/ha = 90 lb/acre | ||||
| 1 For Winter cereals seeded down only. 2 When the response rating for a nutrient is “NR,” application of phosphorus in fertilizer or manure may reduce crop yield or quality. For example, phosphate applications may induce zinc deficiency on soils low in zinc and may increase the risk of water pollution. | ||||
Table 4-21. Potash (K2O) guidelines1 for cereals
| Based on OMAFRA-accredited soil tests. Profitable response to applied nutrients occurs when the increase in crop value, from increased yield or quality, is greater than the cost of the applied nutrient. Where manure is applied, reduce the fertilizer application according to the amount and quality of manure, see Manure section. LEGEND: HR = high response MR = medium response LR = low response RR = rare response NR = no response | ||||
| Sodium Bicarbonate Phosphorus Soil Test | Spring Barley, Spring Wheat, Mixed Grain | Oat, Spring Triticale, Spring Rye | Winter Wheat, Winter Rye, Winter Barley, Winter Triticale | Winter or Spring Grains Seeded Down |
| Potash Required1 | ||||
| 0–15 ppm | 90 kg/ha (HR) | 70 kg/ha (HR) | 50 kg/ha (HR) | 90 kg/ha (HR) |
| 16-30 ppm | 80 kg/ha (HR) | 50 kg/ha (HR) | 40 kg/ha (HR) | 80 kg/ha (HR) |
| 31-45 ppm | 70 kg/ha (HR) | 40 kg/ha (HR) | 30 kg/ha (HR) | 70 kg/ha (HR) |
| 46-60 ppm | 50 kg/ha (HR) | 30 kg/ha (HR) | 20 kg/ha (HR) | 50 kg/ha (HR) |
| 61-80 ppm | 40 kg/ha (MR) | 20 kg/ha (MR) | 20 kg/ha (MR) | 40 kg/ha (HR) |
| 81-100 ppm | 30 kg/ha (MR) | 20 kg/ha (MR) | 20 kg/ha (MR) | 30 kg/ha (MR) |
| 101-120 ppm | 20 kg/ha (MR) | 0 (LR) | 20 kg/ha (LR) | 20 kg/ha (MR) |
| 121–150 ppm | 20 kg/hr (MR) | 0 (RR) | 0 (RR) | 20 kg/ha (MR) |
| 151-180 ppm | 0 (LR) | 0 (RR) | 0 (MR) | 0 (LR) |
| 181-210 ppm | 0 (RR) | 0 (RR) | 0 (RR) | 0 (LR) |
| 211-250 ppm | 0 (RR) | 0 (RR) | 0 (RR) | 0 (RR) |
| 251+ ppm | 0 (NR)1 | 0 (NR)1 | 0 (NR)1 | 0 (NR)1 |
| 100 kg/ha = 90 lb/acre | ||||
| 1 When the response rating for a nutrient is “NR”, application of potash in fertilizer or manure may reduce crop yield or quality. For example, potash application on soils low in magnesium may induce magnesium deficiency. | ||||
Corn Row Syndrome
No-till crops grown without starter fertilizer often develop “corn row syndrome” symptoms. Wheat plants growing over old corn rows will be significantly taller and more vigorous than plants growing between the rows. This is primarily due to higher phosphorus availability from the corn starter fertilizer band, even though the corn crop was grown 2 or 3 years prior to the wheat crop. Fields receiving 58 kg/ha (52 lb/acre) of supplemental P2O5 (100 lb/acre MAP) overcame the variability in wheat growth. The addition of low rates of P with a liquid starter reduced the corn row effect but did not eliminate it. Table 4–22, Corn row syndrome and photo 4-4 show the visual and yield impact of corn row syndrome. Winter wheat is one of the most responsive crops to phosphorus fertilization. This is shown in Table 4–23, Yield response to starter fertilizer, which summarizes 4 years of comparisons on fields with a large range of fertility levels. Even on soils with high fertility there is a response to seed placed starter fertilizer. Note that seed placed starter fertilizer is 4–5 times more efficient than broadcast. Additionally, fall broadcast phosphorus that is not incorporated is subject to movement off target and can be an environmental concern. If the drill is not equipped for seed placed phosphorus seed can be blended with fertilizer (MAP, 11-52-0) and the blend seeded through a single box. Seed and fertilizer do not separate, and this has been a successful practice on many farms. Set seed cups one notch more open than the wheat setting and target a seed drill setting of 10% less than the total of the seed and fertilizer weight/acre as a starting point. Further drill calibration will be required from there. If broadcast phosphorus is chosen as the method of phosphorus application, be sure that the fertilizer is incorporated to prevent off-target concerns.
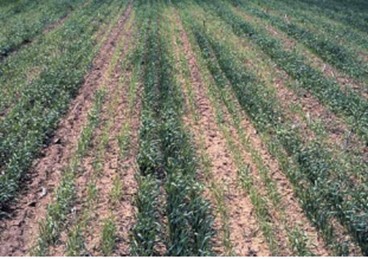
Photo 4-4. Corn row syndrome of winter wheat is caused by fertilizer or pesticide carryover in the rows of previous crops
Table 4-22. Corn row syndrome
| Location | Phosphorous Soil Test | Height | Tissue Phosphorous Levels (DM Basis) | Yield |
| In row | 19 | 107 cm (42 in.) | 0.16% P | 5.13 t/ha (76.3 bu/acre) |
| Between row | 9 | 89 cm (35 in.) | 0.12% P | 4.51 t/ha (67.1 bu/acre) |
| Source: P. Johnson, OMAFRA (2013). | ||||
Table 4-23. Yield response to starter fertilizer
| Fertilizer | P Applied | Yield Increase over Check | ||
| Soil Test P1 6-13 ppm (10 sites) | Soil Test P1 13-21 ppm (9 sites) | Soil Test P1 21-56 ppm (9 sites) | ||
| Liquid 6-24-6 | ||||
| 95 L/ha (10 US gal/acre) (in furrow) | 30 kg P2O2/ha (27 lb P2O2/acre) | 12.0% | 6.2% | 3.3% |
| 40 L/ha (5 US gal/acre) (in furrow) | 14.5 kg P2O2/ha (13 lb P2O2/acre) | 9.7% | 2.7% | 1.8% |
| 21 L/ha (2.5 US gal/acre) (in furrow) | 3 kg P2O2/ha (7 lb P2O2/acre) | 6.3% | 2.9% | 0.9% |
| Dry 7-34-20 | ||||
| 170 kg/ha (150 lb/acre) (in furrow) | 58 kg P2O2/ha (52 lb P2O2/acre) | 17.3% | 6.2% | 4.8% |
| 56 kg/ha (50 lb/acre) (in furrow) | 19 kg P2O2/ha (17 lb P2O2/acre) | 10.9% | 4.7% | 3.5% |
| 225 kg/ha (200 lb/acre) (broadcast) | 76 kg P2O2/ha (68 lb P2O2/acre) | 12.0% | 3.5% | 4.6% |
| Average Check Yield | 5.31 t/ha (79.0 bu/acre) | 5.95 t/ha (88.5 bu/acre) | 6.0 t/ha (89.0 bu/acre) | |
| Minimum Difference2 | 0.2 t/ha (3.2 bu/acre) | 0.2 t/ha (3.2 bu/acre) | 0.2 t/ha (3.1 bu/acre) | |
| Source: Johnson, McClure, Janovicek 2010-2013 | ||||
| 1 Plant available P based on accredited Ontario soil test. 2 Minimum yield difference required (bu/acre)to be confident that differences are not due to random chance. | ||||
Methods of Application
Where phosphate fertilizer is required for cereal crops, it is best drilled with the seed. Seed-placed fertilizers may include some or all of the required nitrogen and potash, depending on rates of application. For further information, see Table 9–24, Maximum safe rates of nutrients in Chapter 9, Soil Fertility and Nutrient Use.
Sulphur
With the reduction of sulphur from atmospheric deposition, sulphur is becoming a more critical and necessary component of a good fertility package. Considerable research over the period from 2010–2015 has found significant sulphur response (0.67-0.94 t/ha or 10–14 bu/acre) on some fields, some years. Other fields, for example, fields with regular manure application, have shown very little response. Figure 4–7, Sulphur response on cereals, shows average yield increase of responsive fields. In these trials, 13 out of 22 sites (59%) were responsive, with an average response of 0.26 t/ha (3.8 bu/acre). Across all trials the average response was 0.13 t/ha (2 bu/acre).
At this time, there is no predictive tool (soil test, tissue test) to determine responsive fields. Additionally, there is a significant year-to-year interaction. Early, warm springs kick start soil biological activity and have little response to sulphur additions while cool, wet springs have much greater response. The best strategy for producers is to conduct their own sulphur trials, to determine responsive fields. Responsive fields have a much greater chance of response year after year. When response is unknown, producers could choose to apply sulphur based on the year (early and dry vs wet and late), or apply sulphur as an “insurance” policy, just in case.
If sulphur applications are considered, Figure 4–7 suggests that optimum application rates are 10–15 kg/ha (9–13 lb/acre) of spring applied sulphate or thiosulphate fertilizer. Some regions suggest sulphur applications on a 10 units nitrogen: 1 unit sulphur basis, as this is the relative proportion in the plant of both nutrients. However, this ignores the sulphur still available from atmospheric deposition. Research, to date, has shown the N:S ratio to be of little value In Ontario. Producers should apply sufficient N and S, and not follow any particular ratio of each.
Fall sulphur is another option to consider. However, fall sulphate sulphur will leach over winter, so fall applications must be in the elemental sulphur form. Elemental sulphur must be transformed to sulphate to be taken up by plants, therefore during cool springs this process may not happen quickly enough to supply the wheat crop’s early season’s demand. Response to fall applied sulphur in research trials has been inconsistent. Spring sulphate is preferred, as availability is known. If fall elemental sulphur applications are chosen, 22-56 kg/ha (20–50 lb/acre of actual S should be applied.
Figure 4-7. Sulphur response in wheat
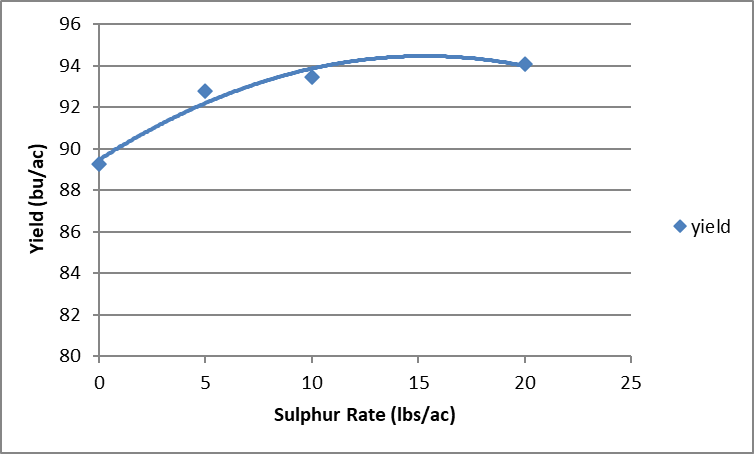
Source: P. Johnson, S. McClure 2012-2014. Summary of 13 responsive sites.
Plant Analysis
For cereals, sample the top two leaves at heading. Sample plants suspected of nutrient deficiency as soon as the problem appears. For plants less than 20 cm (8 in.) tall, sample the entire plant. For sampling at times other than heading, take samples from both deficient and healthy areas of the field for comparison purposes.
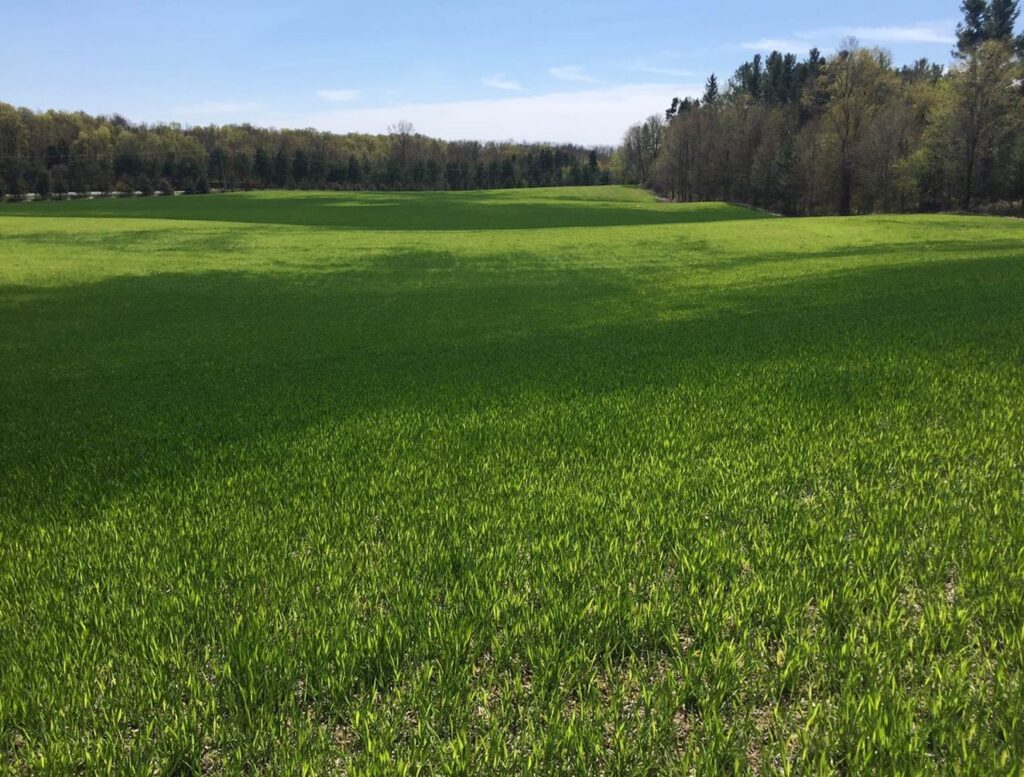
Photo 4-5. Sulphur deficiency in wheat.
Take a soil sample from the same area and at the same time as a plant sample.
Plant tissue analysis results should fall between the critical (low) and normal maximum concentrations. To interpret plant tissue results, refer to Table 4–24, Interpretation of plant analysis for cereal crops and Appendix I, Diagnostic Services.
Table 4-24. Interpretation of plant analysis for cereal crops
| Nutrient | Critical Concentration1 | Maximum Normal Concentration2 |
| Nitrogen (N) | 2.0% | 2.7% |
| Phosphorous (P) | 0.1% | 0.5% |
| Potassium (K) | 1.0% | 3.0% |
| Calcium (Ca) | – | 1.0% |
| Magnesium (Mg) | 0.15% | 1.0% |
| Boron (B) | 3 ppm | 25 ppm |
| Copper (Cu) | 3 ppm | 50 ppm |
| Manganese (Mn) | 15 ppm | 200 ppm |
| Zinc (Zn) | 10 ppm | 70 ppm |
| 1 Yield loss due to nutrient deficiency is expected with nutrient concentrations at or below the critical concentration. 2 Maximum normal concentrations are more than adequate but do not necessarily cause toxicities. | ||
Micronutrients
Manganese
Manganese deficiency frequently occurs when wheat, oat or barley are grown in an organic (muck) soil. It can occasionally occur in mineral soils high in organic matter, or with high soil pH, and in very sandy soils with low organic matter. On oat, manganese deficiency appears as irregular, oval, grey spots on the leaves. See photo 4-6. On barley and wheat, it appears more commonly as a light yellow colour on the leaves with the veins in the leaf remaining slightly darker green. See photo 4-7. Both soil tests and plant tissue analyses are useful in predicting where manganese deficiencies are likely to occur. Both analyses are available at OMAFRA-accredited soil testing laboratories.
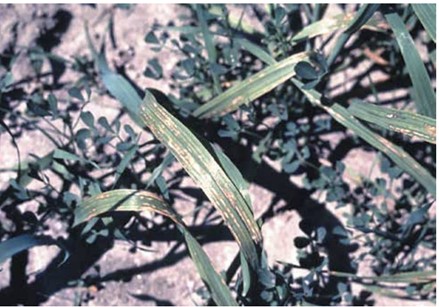
Photo 4-6. Manganese deficiency on oats looks like irregular, oval gray spots.
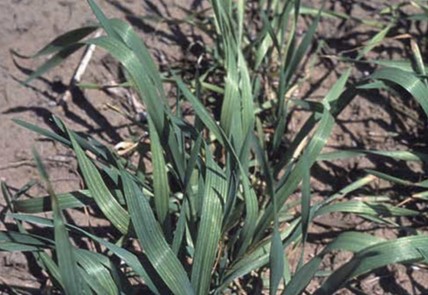
Photo 4-7. Manganese deficiency on winter wheat (pale-yellow interveinal stripes on the leaves) occurs most frequently on high pH, sandy soils or on organic soils.
Correct the deficiency as soon as it is detected by a foliar spray of 2 kg/ha (1.8 lb/acre) manganese, which can be provided from 8 kg/ha (7 lb/acre) manganese sulphate in 200 L (53 gal)of water. Use a “spreader-sticker” in the spray. If the deficiency is severe, a second spray may be beneficial. Winter cereals growing in areas of severe manganese deficiency may require an application in the fall to ensure winter survival. Be cautious of manganese products that are a “shotgun blast” of all nutrients. These products rarely supply more than 1/10th of a kg/ha at maximum application rates, and are much more expensive per unit of Mn. These low-rate applications may briefly correct the deficiency; however repeated applications are often required for acceptable results.
Soil application is not recommended, regardless of source, due to the large amounts of manganese that would be required. In most cases, plant deficiencies are caused by a low availability of manganese from the soil rather than a lack of manganese. Adding more manganese to the soil will not often correct this. However, when small areas of the field are continually deficient, while the balance of the field is fine, soil applications can be attempted in the problem zones to avoid foliar applications on the entire field year after year. Apply from 22 kg/ha (20 lb/acre) Mn from manganese sulphate (MnSO4) to the deficient zone. Repeated applications may be necessary.
Copper
Copper deficiency may occur in organic (muck) soils and could be suspected on rare occasions in very sandy soils. Response to copper has never been established on sandy soils. The most common deficiency symptom is dieback from the tip of the leaf, often accompanied by twisting of the upper leaves. For information on correcting copper deficiencies, see Micronutrient Fertilizers, Chapter 9, Soil Fertility and Nutrient Use. Many claims have been associated with copper applications, especially in regard to disease control. Ontario studies have not been able to substantiate any disease control benefit from copper applications.
Boron
Boron deficiency has not been diagnosed in cereals. Boron applications can be toxic, causing a bleaching of leaf tissue in seedlings. Many tissue samples come back indicating boron deficiency: however, when boron is applied in these situations, no response occurs. Critical values for boron in wheat leaf tissue needs to be reassessed.
Zinc
Zinc deficiency in cereals does not appear to be a problem. Trials on cereals using Micro-Essentials Sulphur Zinc (MESZ) 10-40-0-10-2 have found no benefit from the zinc in this product.
Do not apply mixtures of herbicides and foliar fertilizers to crop foliage unless recommended by reliable agronomists. Always consult the herbicide label.