Plant analysis measures the nutrient content of plant tissue. Comparing the results against the “normal” and “critical” values for the crop can indicate whether nutrient supply is adequate for optimum growth.
Plant analysis is the basis of fertilizer recommendations for some horticultural crops and is a useful supplement to soil testing for evaluation of the fertility status of other crops. It is independent of soil testing and can provide a valuable “second opinion,” especially for phosphorus, potassium, magnesium, and manganese. It is less reliable for nitrogen and zinc. For boron and copper there is no reliable soil test, so plant analysis and visual symptoms are the methods used for diagnosing deficiencies.
Though it can provide useful insight, plant analysis has limitations. Interpreting the results is often difficult since plant tissue analysis on its own does not indicate whether there is a deficiency in soil nutrient supply or stressors causing a reduction in uptake. Critical values of plant tissue analysis are not as well understood as they are in soil currently, meaning it’s difficult to determine the amount of fertilizer required to correct a deficiency. Plant analysis is most useful if combined with visual inspection of the crop and soil conditions, knowledge of past management in the field and a current soil test to provide information about soil nutrient levels and soil pH.
There is no formal accreditation process in Ontario for plant tissue analysis. However, accredited labs that perform plant analysis are monitored and provide quality analysis and interpretation of plant tissue samples.
Sampling
Time of sampling within the growing season has a major effect on the results since nutrient levels vary considerably with the age of the plant.
The most appropriate time for plant tissue sampling varies by crop and depends on whether the sampling is intended to evaluate the overall crop fertility program, or is being used to diagnose an observed nutrient deficiency.
Take samples for plant analysis from at least 20 plants distributed throughout the area chosen for sampling. Each sample should consist of at least 100 g (3.5 oz) of fresh material. Avoid contaminating plant tissue samples with soil. Even a small amount of soil will cause the results to be invalid, especially for micronutrients.
Table 1 gives guidance for optimal growth stage for plant analysis comparison to “maximum normal” and “critical” concentrations (provided by laboratory) within each field crop. Results are difficult to interpret if samples are taken at times other than those recommended.
Table 1. Suggested growth stages and portion of plant for tissue analysis to evaluate fertility program.
| Crop | Suggested growth stage | Portion of plant |
| Corn | R1 (silking) – for most nutrients | Middle 1/3 of ear leaf |
| V4-V5 (5-6 leaf) – for P and Zn | Whole plant | |
| Soybean | R1 (first flower) | Top fully developed trifoliate (3 leaflets plus petiole) |
| Alfalfa | GS4 (late bud stage) | Cut plant at normal mowing height |
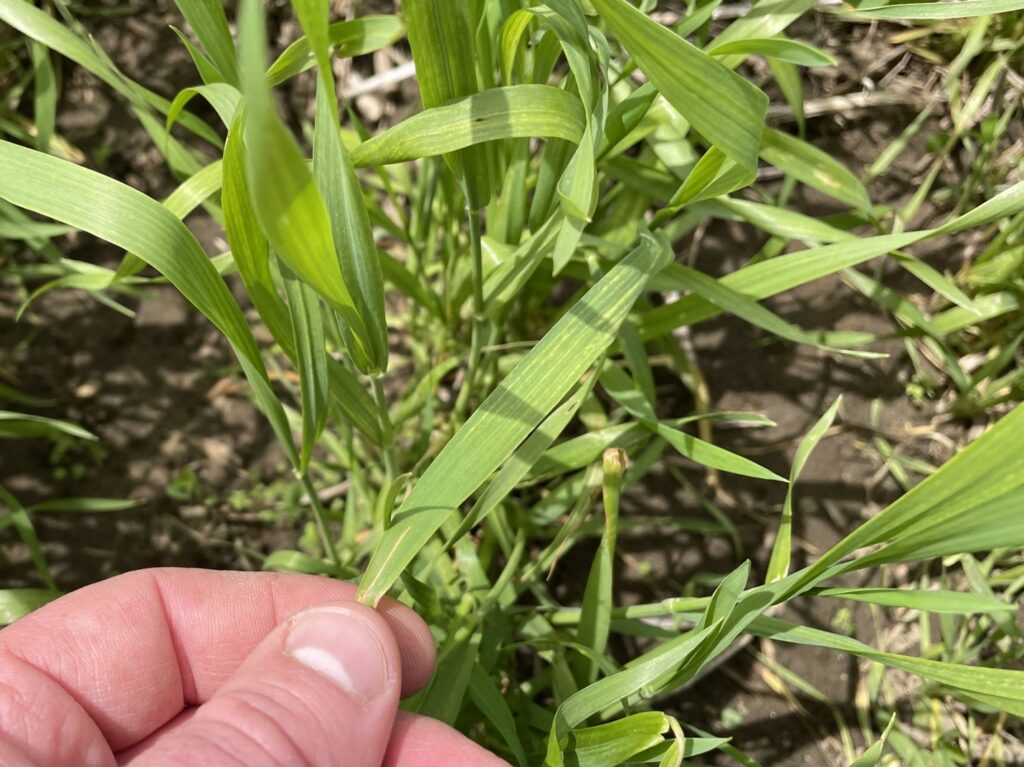
| Cereals | GS59 (heading) | Top two leaves |
| Dry edible beans | R1 (first flower) | Top fully developed trifoliate (3 leaflets plus petiole) |
| Canola | Prior to flowering | Top fully developed leaf |
If a nutrient deficiency is observed, sample plants as soon as possible, regardless of crop growth stage. When sampling outside of the standard times, the nutrient content may not necessarily correspond to critical or normal concentrations. To get a diagnosis, take a sample from the affected area (poor), and take a separate sample from an adjacent area of healthy plants (good) at the same time, for comparison. Do not sample dead plants (see Figure 2).
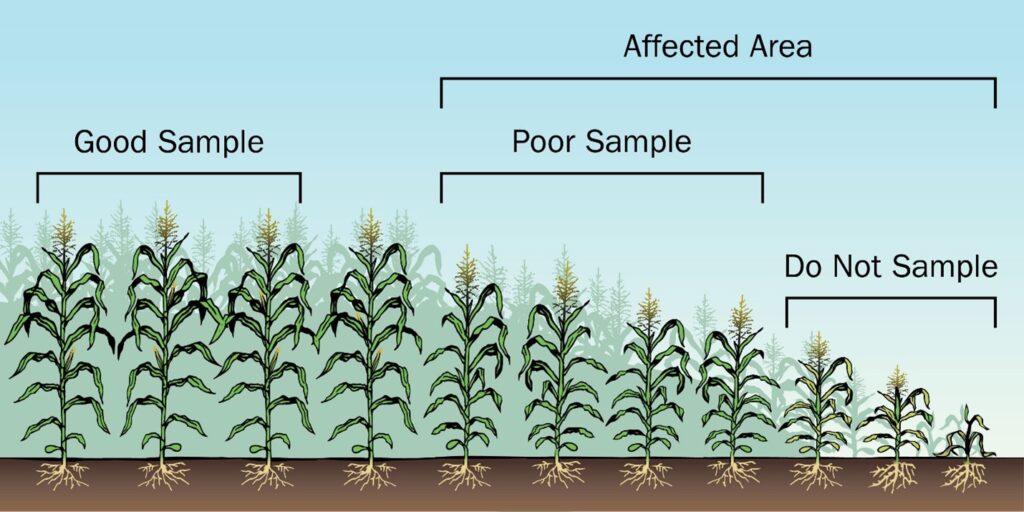
Soil samples from “poor” and “good” areas should also be collected at the same time for diagnostic purposes.
When sampling for suspected deficiencies, the timing of sampling may affect which part of the plant to collect for analysis. Table 2 gives guidance as to the portion of plants to sample for comparative analysis between “poor” and “good” areas within the crop at a given time.
Table 2. Portion of plant to sample at other stages for comparative analysis
| Crop | Growth stage range | Portion of plant |
| Corn | Up to V6 (7 leaf) | Whole plant |
| V7 to R1 (silking) | Youngest fully developed leaf | |
| Soybean | Any stage | Top fully developed trifoliate (3 leaflets plus petiole) |
| Alfalfa | Any stage | Cut plant at normal mowing height |
| Other forages | Any stage | Cut plant at normal mowing height |
| Cereals | Less than 20cm (8 in.) height | Whole plant |
| More than 20cm (8 in.) height | Top two leaves | |
| Dry edible beans | Any stage | Top fully developed trifoliate (3 leaflets plus petiole) |
Sample Preparation
Deliver samples of fresh plant material directly to the laboratory. If samples are not delivered immediately, dry them to prevent spoilage. Samples may be dried in an oven at 65°C or less or dried in the sun provided precautions are taken to prevent contamination from dust or soil. Avoid contact of samples with galvanized (zinc-coated) metal, brass, or copper.
Place leaf or plant samples into paper bags and avoid sealing tightly. Avoid plastic bags for sample collection as the plant tissue will sweat and rot. Label each bag so you will be able to relate the analysis to the location in the field.
Keep records of each field or area sampled, including variety and year. If using tissue analysis to determine trends in fertility levels, be sure to record the fertilizer applied, weather conditions, and final yields.