Taking a soil sample is the first step to understanding your soil’s nutrient status in order to make decisions for your crop’s fertility. The next step in the process is to use the results coming back from the soil laboratory to develop a plan for fertilizer and organic amendment application. However, it can sometimes be a challenge to interpret the numbers on a soil test report. This factsheet provides a reference on how to make sense of a soil test report, whether you are making your own fertilizer plan or creating a fertilizer recommendation with a trusted advisor.
Please keep in mind that there are many ways to create a crop fertility plan, dependent on many different factors. Fertility management recommendations for individual crops will be covered under separate factsheets.
Decoding soil test values
When a soil sample is submitted to an OMAFA-accredited soil test laboratory, it is dried and ground into a small subsample before being analyzed. Soil is treated with an extractant to remove a portion of the nutrient that is related to the amount available to plants.
It’s important to note that the extractants used in OMAFA-accredited tests don’t necessarily line up with soil lab procedures in other provinces or US states. For example, other areas use Mehlich III extractions for phosphorus, but Ontario research has shown more accurate and consistent results using sodium bicarbonate extractions when tested on the wide range of Ontario soils.
Table 1. Correlation of extractable P with P uptake in controlled greenhouse conditions.
| Extractant | All soils1 correlation (r2)* | pH>7.02 correlation (r2)* | pH 6.1-7.03 correlation (r2)* | pH<6.14 correlation (r2)* |
|---|---|---|---|---|
| Sodium bicarbonate | 0.74 | 0.79 | 0.64 | 0.87 |
| AB-DPTA | 0.73 | 0.71 | 0.63 | 0.95 |
| Bray-Kurtz P1 | 0.54 | 0.52 | 0.33 | 0.73 |
| Bray-Kurtz P2 | 0.65 | 0.60 | 0.40 | 0.90 |
| Mehlich III | 0.66 | 0.57 | 0.40 | 0.93 |
2 n = 46 soils
3 n = 30 soils
4 n = 12 soils
* An r2 of 1.00 is complete agreement.
The soil test value for a given nutrient does not indicate the total amount of nutrient in the soil, but can be used as an index to signify how available it may be to the plant, and how likely the plant is to respond to fertilization of that nutrient.
Soil test values are reported most often in parts per million (ppm), which is equivalent to one milligram of nutrient per kg of soil (mg/kg). Most labs associate a code to give an indication of the probability of crop response from added fertilizer based on the extracted nutrient level. Most commonly used are:
- HR = high likelihood of response, MR = medium response, LR = low response, RR = rare response, NR = no response
- VR = very low, L = low, M = medium, H = high, VH = very high, E = excessive
It’s important to remember that soil test results represent a snapshot in time, and accuracy is only as good as that which with it was sampled in the field.
Soil test report
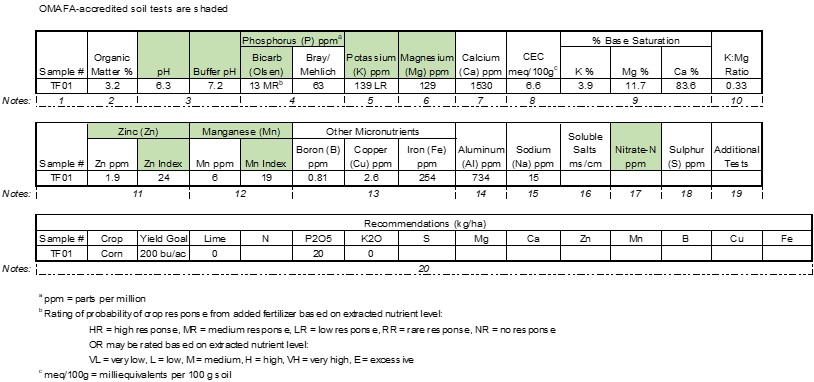
Soil test value breakdown
For recommendations shown in OMAFA publications or factsheets to be used for fertility recommendations, it’s critical for soil test laboratories to use OMAFA-accredited extractants and procedures.
- Sample number:
- Required to match results to recorded areas of sampling.
- Organic matter:
- Not used directly for fertilizer recommendations, but important for soil fertility as it enhances the soil’s ability to hold and cycle plant available nutrients. Labs measure organic matter using different methods, so accurately tracking changes over time requires consistency in the lab used.
- Higher organic matter % is generally better, but it is slow to build. Ideal soil organic matter percentages by soil type: sand soils = 3.1%+, sandy loam soils = 3.6%+, loam soils = 4.1%+, clay or clay loam soils = 4.5%+.
- Lab test – non-accredited test, but usually tested using either loss on ignition, or modified Walkley Black method
- pH and Buffer pH:
- Optimum soil pH range for most crops is 6.0-7.5.
- Raising pH: If lime is required to raise soil pH, the buffer pH (BpH) estimates the amount of lime needed. Use dolomitic lime if soil Mg is below 100ppm. See Lime recommendations factsheet.
- Lowering pH: High soil pH (7.8-8.2) is very well buffered and resistant to change, making it extremely difficult and costly to lower.
- Lab test – extracted using saturated paste or 1:1 water (pH), or SMP or Sikora (buffer pH).
- Phosphorus (P):
- Olsen or Sodium Bicarb (bicarbonate) measure is used for recommendations – more accurate across low, moderate, and high pH ranges in Ontario soils and conditions. Other test methods (such as Bray P1 or Mehlich III) may be included on lab reports.
- See recommendations for individual crops. In very general terms:
- P < 10 ppm – most field crops (corn, soybeans, cereals, forages, edible beans, canola) show high chance of profitable response to added P.
- P = 11-15 ppm – most field crops show moderate chance of response to additional P.
- P = 16-30 ppm – corn, winter cereals may show response to a low-rate P starter. Other crops unlikely to show any response. Individual field testing is recommended.
- P > 31 ppm – unlikely to show response to added P.
- Lab test – extracted using sodium bicarbonate.
- Potassium (K):
- See recommendations for individual crops. In very general terms:
- K < 60 ppm – most field crops show high chance of profitable response to added K.
- K = 61-120 ppm – most crops show moderate chance of response to additional K. Forages may be highly responsive up to 80-100 ppm K.
- K = 120-150 ppm – some cereal and forage crops may be moderately responsive up added K. Other crops unlikely to show profitable response.
- K > 150 ppm – unlikely to show response to added K.
- High soil test K levels can result in luxury consumption of K in forage grasses can lead to health concerns for dairy cows.
- Soil test lab – extracted using ammonium acetate.
- See recommendations for individual crops. In very general terms:
- Magnesium (Mg):
- In very general terms:
- Mg < 20 ppm – most field crops will require an application of Mg from magnesium sulphate, sulphate of potash magnesia, or dolomitic lime if pH is low.
- Mg < 100 ppm – if lime is required, use dolomitic lime.
- High soil test K can interfere with availability of Mg to plants.
- Lab test – extracted using ammonia acetate.
- In very general terms:
- Calcium (Ca):
- Soil Ca levels are usually adequate if pH is suitable for plant growth.
- Soil test lab – non-accredited test, but usually extracted using ammonium acetate.
- Cation Exchange Capacity (CEC):
- Not used for OMAFA fertilizer recommendations.
- CEC is a function of soil texture (especially clay particles) and soil organic matter. It is a reflection of the soil’s total ability to retain cations (K, Mg, Ca, Na, H) and can be useful as an indication of potential fertility.
- Measured in milliequivalents per 100 grams of soil (meq/100g), which is a sum of electrical charge inherent in the soil.
- Lab test – non-accredited test, but often estimated from nutrients extracted using ammonium acetate.
- % Base Saturation:
- Not used for OMAFA fertilizer recommendations. Lab reports may also include %Na (sodium) and %H (hydrogen).
- Calculated from reported cations (K, Mg, Ca, Na, H) and CEC.
- K:Mg Ratio:
- Not used for OMAFA fertilizer recommendations.
- May be used as an indicator to balance K and Mg fertilizer application. Especially on coarse textured soils low in organic matter, high soil K or Mg may limit the availability of the other. Sources differ on the ideal K:Mg, and OMAFA has no accreditation for this ratio.
- Zinc (Zn) and Zinc Index:
- Availability of Zn is influenced more by soil pH than the actual amount of nutrient in the soil. Soil tests in Ontario utilize an index to identify potential for crop response.
- Interpreting Zinc Index:
- < 15 – likely deficient for corn
- 15-25 – adequate for most crops, but borderline deficient for corn
- 25-200 – adequate for most crops
- > 200 – possible contamination of field or sampling equipment
- If Zn index is not reported, it can be calculated using this formula:
- Zn index = 203 + (4.5 x Zn ppm reported) – (50.7 x soil pH) + (3.33 x [soil pH]2)
- Soil test lab – extracted using DTPA and indexed via pH.
- Manganese (Mn) and Manganese Index:
- Availability of Mn is influenced more by soil pH than the actual amount of nutrient in the soil. Soil tests in Ontario utilize an index to identify potential for crop response.
- Interpreting Manganese Index:
- < 15 – likely deficient for cereals and soybeans
- 15-30 – adequate for most crops, but borderline deficient for cereals and soybeans
- > 30 – adequate for most crops
- If Mn index is not reported, it can be calculated using this formula:
- If soil pH ≤ 7.1: Mn Index = 498 + (0.248 x Mn ppm reported) – (137 x soil pH) + (9.64 x [soil pH]2)
- If soil pH > 7.1: Mn Index = 11.25 + (0.248 x Mn ppm reported)
- Soil test lab – extracted using phosphoric acid and indexed via pH.
- Other micronutrients:
- Soil tests may not be well enough correlated to be used for fertilizer recommendations. Tissue analysis is often the best method to determine the crop’s micronutrient status.
- Labs may offer tests for other micronutrients not listed here.
- Aluminum (Al):
- High soil Al can be toxic to plants at low pH. High Al content may also react with P, rendering it unavailable for plant uptake.
- Sodium (Na):
- Not an essential nutrient for crop production but may be analyzed where environmental contamination may be suspected, as Na can be toxic to plants.
- Soluble Salts:
- High concentrations of salts interfere with water uptake in plants and can injure roots and restrict root growth.
- Measured in millisiemens/centimeter (ms/cm), a reading of electrical conductivity of soil-water slurry at soil test lab.
- Interpreting conductivity reading and test ratings:
- 0-0.25 ms/cm = low rating
- 0.26-0.45 ms/cm = medium
- 0.46-0.70 ms/cm = high – may reduce emergence and cause slight to severe damage to salt-sensitive plants
- 0.71-1.00 ms/cm = excessive – may prevent emergence and cause slight to severe damage to most plants
- 1.00 ms/cm= excessive – expected to cause severe damage to most plants
- Nitrate-Nitrogen (NO3-N):
- Can be used to fine-tune nitrogen applications for corn and spring barley pre-plant, or for corn pre-sidedress. No other crops have been calibrated.
- Nitrate is mobile in the soil; results will vary greatly week to week.
- See recommendations for individual crops.
- Requires taking soil cores at 30cm depth instead of typical 15cm. Proper handling of samples is required: keeping samples cool and refrigerated (but not frozen), and shipping to lab as soon as possible.
- Lab test – extracted using potassium chloride.
- Sulphur (S):
- Similar to nitrate-N, sulphur is mobile in the soil, and results will vary greatly week to week.
- Requires taking soil cores at 30cm depth instead of typical 15cm, and handling and shipping similar to nitrate-N.
- Not currently accredited, but research using calcium chloride as an extractant is being conducted.
- Other tests:
- Labs may offer a variety of soil tests not included here, such as:
- Soil texture – particle size analysis (sand, silt, clay percentages)
- Bulk density
- Soil health testing
- Nematode analysis
- Pesticide residue
- Contact your service provider for interpretation of these tests.
- Labs may offer a variety of soil tests not included here, such as:
- Recommendations:
- Labs may offer their own interpretation of fertilizer guidelines.
OMAFA guidelines for applying fertilizers to field crops can be found on FieldCropNews.
References
- Bates, Thomas E. 1990. Prediction of phosphorus availability from 88 Ontario soils using five phosphorus soil tests. Communications in Soil Science and Plant Analysis. 21: 1009-1023.