Potassium is the most important macronutrient required for soybean production in Ontario. Many Ontario soybean fields show potassium deficiency symptoms each year due to the large amount of potassium soybeans require, and the inability of soybean roots to take up potassium in dry soil conditions. Symptoms include yellowing and eventually browning of the margins of older leaves early in the growing season, see Figure 1. Potassium deficiency can also increase soybean aphid reproduction and damage on affected plants, see figure 2.
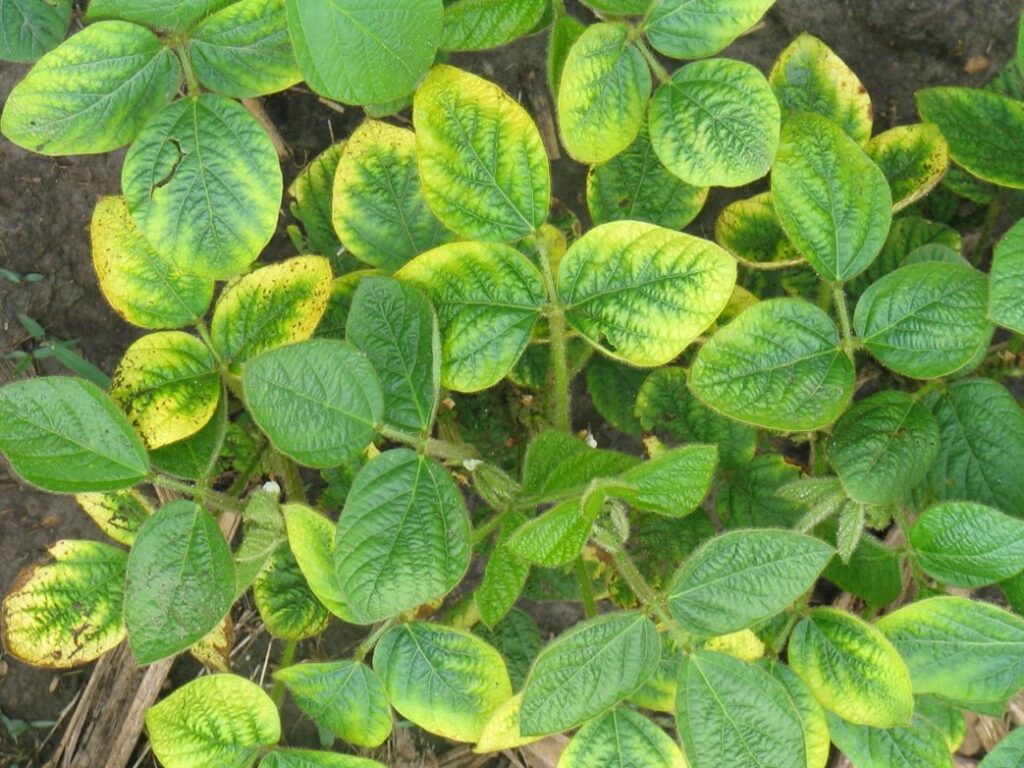
Figure 1. Potassium (K) deficient soybean plants early in the growing season
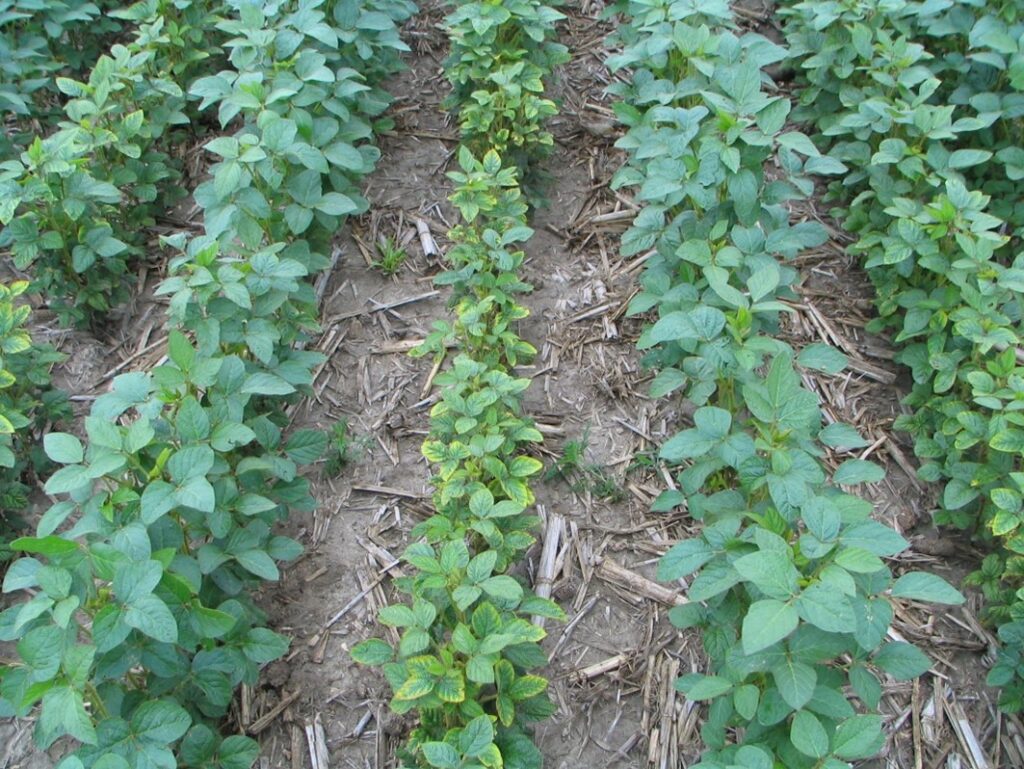
Figure 2. Potassium (K) deficiency in the center row causing increased soybean aphid numbers and damage. The center row did not receive banded K.
In late August or September as the plant remobilizes nutrients to the seed, deficiency symptoms may also become evident at the top of the canopy, see Figure 3. Visual phosphorus deficiency symptoms are rare in Ontario. Plants with phosphorus deficiency are stunted and leaves may have a slight blue-green appearance.
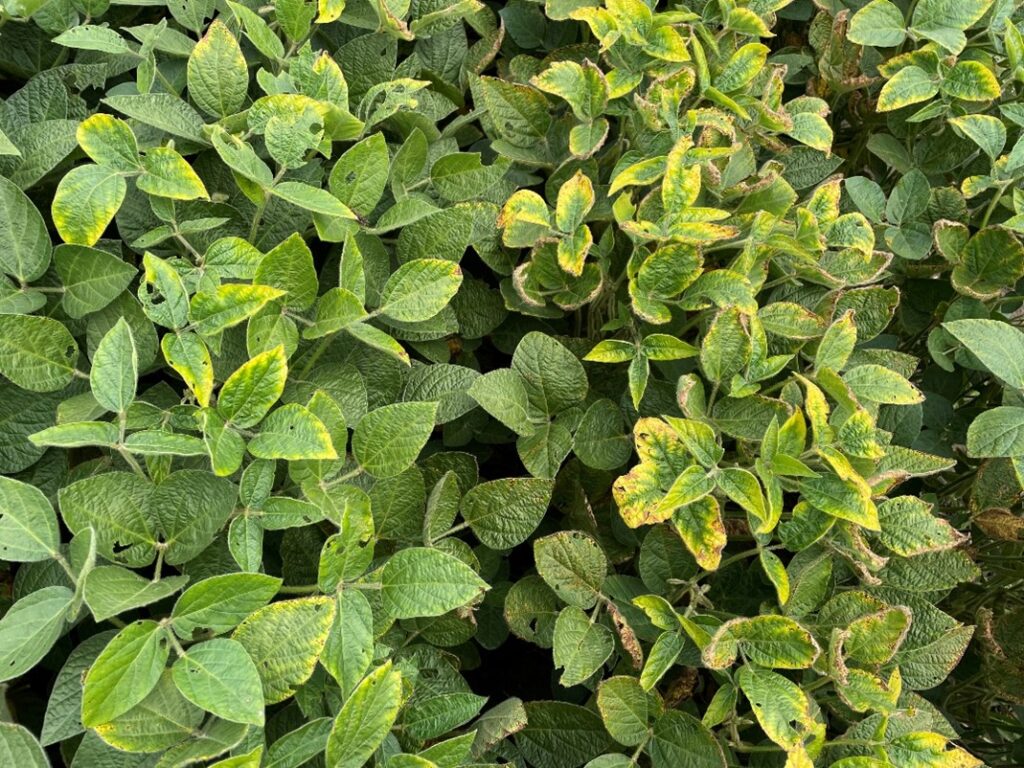
Figure 3. Potassium (K) deficient soybean plants late in the growing season.
Potash (K2O) guidelines for soybeans are given in Table 1. Phosphorus is also important, but soybeans only require about half the amount of phosphorus compared to potassium. Phosphate (P2O5) guidelines are given in Table 2. These guidelines are based on OMAFA-accredited soil tests using the sufficiency approach, which applies the most economic rate of nutrients for a given crop year. In other words, these tables provide the amount of fertilizer required to maximize profits for one year of production, not the highest possible yield. It must be stressed that the sufficiency approach does not fully take into consideration crop removal and may reduce soil test levels over time, depending on the amount of fertilizer applied. To maintain soil test levels, it’s important to realize that a 50 bu/ac crop of soybeans removes approximately 45 kg/ha (40 lb/ac) of P2O5 and 78 kg/ha (70 lb/ac) of K2O. When manure is applied, reduce the fertilizer application according to the amount and quality of manure. See Factsheet, Typical amounts of available nitrogen, phosphate and potash from different types of organic nutrient sources. Soybeans respond well to manure, but the rate of manure applied should be moderate. Excess amounts may lead to reduced plant stands, seed corn maggot infestations, or excess vegetative growth causing lodging and diseases.
Table 1. Potash (K2O) Guidelines for Soybeans
| Based on OMAFRA-accredited soil tests. Profitable response to applied nutrients occurs when the increase in crop value, from increased yield or quality, is greater than the cost of the applied nutrient. | |
| LEGEND: HR = high response MR = medium response LR = low response RR = rare response NR = no response | |
| Ammonium Acetate Potassium Soil Test | Potash Required |
| 0-15 ppm | 120 kg/ha (HR) |
| 16-30 ppm | 110 kg/ha (HR) |
| 31-45 ppm | 90 kg/ha (HR) |
| 46-60 ppm | 80 kg/ha (HR) |
| 61-80 ppm | 60 kg/ha (MR) |
| 81-100 ppm | 40 kg/ha (MR) |
| 101-120 ppm | 30 kg/ha (MR) |
| 121-150 ppm | 0 (LR) |
| 151-250 ppm | 0 (RR) |
| 251 ppm + | 0 (NR)1 |
| 100 kg/ha = 90 lb/acre | |
| 1 When the response rating for a nutrient is “NR”, application of potassium in fertilizer or manure may reduce crop yield or quality. For example, potash application on soils low in magnesium may induce magnesium deficiency. | |
Table 2. Phosphate (P2O5) Guidelines for Soybeans
| Based on OMAFRA-accredited soil tests. Profitable response to applied nutrients occurs when the increase in crop value, from increased yield or quality, is greater than the cost of the applied nutrient. | |
| LEGEND: HR = high response MR = medium response LR = low response RR = rare response NR = no response | |
| Sodium Bicarbonate Phosphorus Soil Test | Phosphate Required |
| 0-3 ppm | 80 kg/ha (HR) |
| 4-5 ppm | 60 kg/ha (HR) |
| 6-7 ppm | 50 kg/ha (HR) |
| 8-9 ppm | 40 kg/ha (HR) |
| 10-12 ppm | 30 kg/ha (MR) |
| 13-15 ppm | 20 kg/ha (MR) |
| 16-30 ppm | 0 kg/ha (LR) |
| 31-60 ppm | 0 kg/ha (RR) |
| 61 ppm+ | 0 kg/ha (NR)1 |
| 100 kg/ha = 90 lb/acre | |
| 1 When the response rating for a nutrient is “NR”, application of phosphorous in fertilizer or manure may reduce crop yield or quality. For example, phosphate applications may induce zinc deficiency in soils low in zinc and may increase the risk of water pollution. | |
Yield Responses to Fertilizing Soybeans
Soybeans are often not fertilized because they have a reputation for not responding to applied commercial fertilizer. At best, some growers apply only potash, mainly because soybeans have such a large requirement for potassium and because potassium deficiency has such obvious leaf symptoms. A multi-year Ontario experiment summarized in Table 3 showed that, grown in a low testing soil (P less than 20 ppm, and K less than 120 ppm) soybeans yielded 51 bu/ac. When a blend of MAP (11-52-0) and potash (0-0-60) was applied in the spring to this low testing soil yields increased by 5 bu/ac, to 56 bu/ac. An in-furrow application of 3 US gallons/acre of liquid 6-24-6 increased yields by 2 bu/ac over the untreated check. This study provides strong evidence that a yield response of about 10% can be expected when fertilizing a low testing field. However, no statistical yield was gained from fertilizing where the soil test was above 20 ppm for P and 120 ppm for K, except for a small gain with MAP. These trials demonstrate that fertilizing only potash and ignoring phosphate, is not advisable for soybean production. In this study, soybeans yielded higher when grown in a medium testing soil (P greater than 20 ppm, and K greater than 120 ppm) compared to a low testing soil. Even when spring fertilizer was applied to the low testing soil, it was slightly lower than the medium testing soil without fertilizer (59 bu/ac compared to 56 bu/ac).
Table 3. Soybean Yield Response to Background Fertility and Spring Applied Fertilizer
| Spring Applied at Planting (per ac) | Background Fertility (soil test ppm) | |||
| P <20 K <120 | P >20 K <120 | P <20 K >120 | P >20 K >120 | |
| Bu/ac | ||||
| Untreated | 51 c | 53 c | 54 c | 59 b |
| 6-24-6 @ 3 gal (in-furrow) | 53 b | 54 b | 55 b | 59 b |
| 11-52-0 @ 100 lbs. (2×2) | 54 b | 55 b | 58 a | 61 a |
| 0-0-60 @ 80 lbs. (2×2) | 53 b | 57 a | 53 c | 59 b |
| 6-28-28 @ 90 to 180 lbs. (2×2) | 56 a | 58 a | 58 a | 60 ab |
| Mean separation within column statistically significant at P = 0.05. Average across 21 site-years. 2011-2017. These trials were planted in 15” rows. Source: Hooker (UG); Bohner (OMAFRA) | ||||