
Turning soil tests into fertilizer recs
Take one soil test, give it to two agronomists, and get four different fertilizer recommendations. How is this possible?
Soil testing is one of the most profitable operations that a farm business can do, assuming proper sampling technique, and aligning samples with the field conditions and management. Soil testing is the basis for nutrient recommendations for Ontario field crops. OMAFA-accredited labs ensure that soil test results match Ontario response data.
However, translating those soil test results can be challenging when creating fertilizer recommendations. Interpretation of a single ppm reading, especially of phosphorus (P) and potassium (K), can lead to several different fertilizer recommendations depending on the objective for fertilizing.
Read on learn to learn about different approaches to fertilization and how to select the one that best suits your needs.
Fertilization philosophy
The right P and K recommendation will match the producer’s goals for an individual field. These goals can vary by crop, year, location, land ownership, and budget, so it’s critical to revisit a fertility plan regularly. There are three main approaches to determining P and K application:
- Sufficiency approach – fertilizing to yield response
- Crop removal approach – replacing nutrients removed with harvest
- Build and maintain approach – build up low testing P and K to a critical level (e.g., 20 ppm P and 120 ppm K) to prevent limiting yield by those nutrients.
Each of these fertilization approaches may be appropriate depending on the goal of the individual farm. The sufficiency approach favours maximizing value in the short term but may limit yield long term. The crop removal approach simply aims to keep soil test levels where they currently are, through each crop in the rotation. The build and maintain approach depends on higher soil test levels bringing higher crop yields over the long term, providing a payoff for the increased investment of fertilizer up front.
Recommended P and K fertilizer rates for the sufficiency and crop removal approaches are relatively straightforward using recommendations in OMAFA’s Agronomy Guide, Publication 811.
- A recommendation for a 200 bu/ac crop of corn in soils testing 8 ppm P and 50 ppm K would require 63 lb P2O5/ac and 99 lb K2O/ac using the sufficiency approach.
- The crop removal approach for the same field would recommend 84 lb P2O5/ac and 56 lb K2O/ac.
- Often, a hybrid of both systems is used where the higher rate between the two approaches is recommended. The Crop Nutrient tool on OMAFA’s AgriSuite can help with interpreting soil test results using these two approaches.
It’s important to account for all forms of P, K and other. Manure, biosolids, compost, and other organic amendments have valuable crop nutrients that feed the crop and can build soil test levels. AgriSuite’s Organic Amendment tool is a simple way to calculate available plant nutrient values from these sources.
Build and maintain approach
The objective of the build and maintain approach is to build up low testing soils over time to a critical level by fertilizing more nutrient than the crop will remove, while applying rates close to crop removal at moderate soil test levels, and drawing down high soil test levels. Assuming low soil test P and K levels, this approach will require higher fertilizer inputs upfront, but aims to keep nutrients from limiting yield.
Recent research led by Dr. Dave Hooker at the University of Guelph – Ridgetown Campus looked at comparing the sufficiency and build and maintain approaches in corn, soybeans, and wheat. By building soils to approximately 20 ppm P and 120 ppm K, the research showed that “maintaining” moderate soil test P and K with crop removal rates compared to an unbuilt soil (soil test P <12 ppm and K <80 ppm) increased yields in corn, soybeans, and wheat by 5.9, 0.8, and 6.7 bu/ac, respectively.
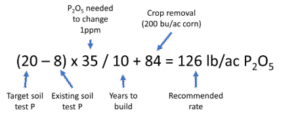
Building soil test values takes time and input; to build soil test P or K by 1 ppm takes approximately 35 lb P2O5/ac or 20 lb K2O/ac. Calculating the recommended rate involves several factors, as shown in Figure 1. This rate calculation should change yearly, depending on the nutrient removal of the intended crop, as well as any changes to economics that may increase or decrease the timeline to build. Often, critical soil level targets of 20 ppm P and 120 ppm K are used in Ontario for field crops, as response becomes less likely at higher test levels.
Calculating a build recommendation can also be relatively simple: applying a somewhat higher rate of P or K than the crop removes at harvest. Whether it’s 5% or 20% more than crop removal may depend on price of fertilizer, cost of production, and long-term outlook for the field.
For example, a 200 bu/ac crop of corn removes approximately 84 lb P2O5/ac and 56 lb K2O/ac. Applying a 15% build would equate to roughly 97 lb P2O5/ac and 64 lb K2O/ac to be applied to the field, equivalent to 186 lb/ac of MAP, and 107 lb/ac of potash. It’s still important to check out OMAFA fertilizer guidelines, as low testing soils may respond to higher rates of fertilizer than calculated.
Risks of building soil test levels
The decision to build soil P and K is also determined in part by the risk of loss of that fertilizer to the environment. It is important that higher rates of fertilizer are placed in the soil in ways that are less likely to be lost through overland runoff or preferential flow to tile drains. Soil erosion can carry applied nutrients from the field, and erosion management is important to any fertility plan.
Incorporation after nutrient application, subsurface banding, and strip-till are great ways to lower the risk of nutrient losses. Applying nutrients in the spring or summer gives more time for the nutrient to bind with soil particles, compared to the late fall or winter months where higher soil water content may move nutrients off the field quicker. AgriSuite’s Phosphorus Loss Assessment tool (PLATO) provides P loss risk estimates with different application methods.
Higher rates of fertilizer lead to increased costs while building low soil test levels. However, P and K levels don’t necessarily have to be built over a specific timeframe, but can be a focus at opportune times during a rotation (for example after wheat harvest when organic amendments or higher rates can be incorporated). The best crop fertility plans adjust for factors like cost of production on a year-to-year basis, as well as the latest research of crop and soil response to plant nutrition.
Choose your fertilization approach by field
The Build and Maintain approach of fertilization may make sense for some fields in your operation and not others. It’s important to look at your soil test and have a goal for the field before planning to fertilize. Continued soil testing, ideally at the same time of year and same place in the rotation, may change the approach as well. This is a critical part of a good fertility plan.
Creating a fertilizer plan from a soil test need not be done alone. Contact a trusted Certified Crop Advisor (CCA) and be sure to discuss fertilization goals, budget, and risk reduction plans to work towards a responsible crop fertility plan that suits the needs of your farm.
OMAFA Weather Summary: Thurs July 3—Wed July 9, 2025
| Location | Highest Temp (°C) | Lowest Temp (°C) | Rain for Week (mm) | Rain Since April 1st (mm) | GDD0C April 1st | GDD5C April 1st | CHU May 1st |
| HARROW | |||||||
| 2025 | 33.1 | 13.7 | 3.5 | 295.0 | 1526 | 1049 | 1472 |
| 2024 | 29.6 | 14.8 | 8.9 | 267.6 | 1683 | 1181 | 1649 |
| 2023 | 30.3 | 15.9 | 40.9 | 243.7 | 1480 | 991 | 1413 |
| 10 YR Norm (2011-2020) | 28.6 | 16.5 | 35.3 | 323.6 | 1505 | 1007 | 1548 |
| RIDGETOWN | |||||||
| 2025 | 33.6 | 14.0 | 20.4 | 228.8 | 1444 | 969 | 1381 |
| 2024 | 30.1 | 14.7 | 1.3 | 341.1 | 1586 | 1089 | 1550 |
| 2023 | 30.2 | 13.1 | 46.3 | 328.2 | 1404 | 924 | 1313 |
| 10 YR Norm (2011-2020) | 29.4 | 14.3 | 24.0 | 262.0 | 1410 | 917 | 1437 |
| SARNIA | |||||||
| 2025 | 33.5 | 14.0 | 13.5 | 277.0 | 1396 | 927 | 1289 |
| 2024 | 31.2 | 15.0 | 6.8 | 224.9 | 1568 | 1074 | 1506 |
| 2023 | 32.2 | 14.0 | 29.9 | 213.0 | 1355 | 875 | 1224 |
| 10 YR Norm (2011-2020) | 29.5 | 15.2 | 24.8 | 288.8 | 1362 | 872 | 1376 |
| LONDON | |||||||
| 2025 | 31.6 | 11.3 | 8.8 | 258.4 | 1360 | 906 | 1325 |
| 2024 | 29.1 | 15.2 | 1.9 | 303.3 | 1563 | 1063 | 1536 |
| 2023 | 30.1 | 11.7 | 24.7 | 296.3 | 1398 | 918 | 1312 |
| 10 YR Norm (2011-2020) | 29.1 | 14.6 | 22.7 | 289.0 | 1387 | 898 | 1416 |
| BRANTFORD | |||||||
| 2025 | 32.0 | 9.8 | 2.8 | 292.0 | 1384 | 922 | 1315 |
| 2024 | 30.4 | 14.0 | 4.0 | 248.6 | 1506 | 1011 | 1484 |
| 2023 | 30.8 | 11.3 | 46.4 | 270.4 | 1389 | 908 | 1306 |
| 10 YR Norm (2011-2020) | 29.9 | 13.5 | 1.8 | 252.0 | 1367 | 881 | 1383 |
| WELLAND | |||||||
| 2025 | 31.8 | 11.0 | 2.2 | 207.5 | 1428 | 957 | 1383 |
| 2024 | 30.2 | 15.7 | 0.0 | 307.0 | 1566 | 1066 | 1552 |
| 2023 | 30.6 | 11.9 | 23.5 | 263.0 | 1393 | 907 | 1298 |
| 10 YR Norm (2011-2020) | 28.6 | 15.2 | 12.6 | 281.2 | 1389 | 899 | 1417 |
| GODERICH | |||||||
| 2025 | 31.4 | 10.8 | 1.5 | 216.1 | 1309 | 849 | 1247 |
| 2024 | 29.2 | 13.5 | 0.0 | 200.6 | 1402 | 913 | 1348 |
| 2023 | 31.0 | 12.2 | 16.4 | 163.1 | 1272 | 809 | 1168 |
| 10 YR Norm (2011-2020) | 26.8 | 13.7 | 10.7 | 241.5 | 1242 | 762 | 1248 |
| ELORA | |||||||
| 2025 | 31.3 | 9.3 | 12.2 | 270.1 | 1272 | 820 | 1219 |
| 2024 | 28.3 | 12.5 | 0.8 | 260.5 | 1403 | 916 | 1386 |
| 2023 | 30.1 | 9.4 | 30.8 | 219.0 | 1283 | 819 | 1202 |
| 10 YR Norm (2011-2020) | 28.1 | 12.3 | 20.1 | 285.8 | 1237 | 761 | 1251 |
| MOUNT FOREST | |||||||
| 2025 | 31.1 | 9.1 | 8.7 | 247.4 | 1266 | 818 | 1206 |
| 2024 | 28.6 | 12.5 | 2.0 | 243.8 | 1387 | 905 | 1368 |
| 2023 | 30.1 | 10.6 | 20.0 | 252.5 | 1279 | 820 | 1199 |
| 10 YR Norm (2011-2020) | 27.8 | 12.6 | 20.2 | 281.9 | 1218 | 751 | 1245 |
| BARRIE | |||||||
| 2025 | 32.0 | 9.7 | 3.0 | 222.0 | 1261 | 810 | 1227 |
| 2024 | 28.7 | 13.7 | 7.2 | 390.2 | 1345 | 862 | 1338 |
| 2023 | 30.4 | 11.9 | 30.6 | 291.5 | 1262 | 798 | 1186 |
| 10 YR Norm (2011-2020) | 28.0 | 12.7 | 11.3 | 259.7 | 1197 | 732 | 1219 |
| PETERBOROUGH | |||||||
| 2025 | 32.6 | 6.5 | 0.4 | 203.2 | 1307 | 845 | 1266 |
| 2024 | 31.1 | 12.0 | 7.8 | 295.3 | 1383 | 895 | 1353 |
| 2023 | 31.5 | 8.9 | 1.9 | 205.2 | 1299 | 823 | 1186 |
| 10 YR Norm (2011-2020) | 28.8 | 12.4 | 10.5 | 258.1 | 1253 | 777 | 1257 |
| KEMPTVILLE | |||||||
| 2025 | 33.2 | 10.4 | 37.2 | 225.8 | 1366 | 902 | 1330 |
| 2024 | 30.0 | 16.1 | 19.6 | 319.5 | 1461 | 973 | 1458 |
| 2023 | 33.9 | 16.4 | 0.5 | 245.9 | 1386 | 914 | 1281 |
| 10 YR Norm (2011-2020) | 29.8 | 14.4 | 15.8 | 278.1 | 1315 | 840 | 1337 |
| SUDBURY | |||||||
| 2025 | 30.0 | 7.6 | 31.7 | 233.7 | 1091 | 672 | 1097 |
| 2024 | 27.5 | 14.6 | 7.9 | 362.3 | 1227 | 769 | 1233 |
| 2023 | 31.3 | 12.7 | 40.2 | 354.5 | 1188 | 765 | 1151 |
| 10 YR Norm (2011-2020) | 28.2 | 12.1 | 19.6 | 259.3 | 1097 | 682 | 1154 |
| EARLTON | |||||||
| 2025 | 30.6 | 6.9 | 48.5 | 236.5 | 1052 | 650 | 1067 |
| 2024 | 28.2 | 12.5 | 12.8 | 328.0 | 1215 | 764 | 1230 |
| 2023 | 33.6 | 13.2 | 32.6 | 236.3 | 1177 | 753 | 1147 |
| 10 YR Norm (2011-2020) | 28.4 | 11.0 | 18.6 | 233.2 | 1014 | 622 | 1075 |
| SAULT STE MARIE | |||||||
| 2025 | 29.2 | 6.9 | 10.1 | 229.1 | 1043 | 617 | 980 |
| 2024 | 23.4 | 12.3 | 20.5 | 363.5 | 1117 | 645 | 1047 |
| 2023 | 30.6 | 9.9 | 6.0 | 212.9 | 1130 | 704 | 1057 |
| 10 YR Norm (2011-2020) | 26.9 | 9.5 | 19.1 | 262.7 | 968 | 555 | 964 |
| THUNDER BAY | |||||||
| 2025 | 28.0 | 6.8 | 31.8 | 242.0 | 948 | 550 | 967 |
| 2024 | 27.8 | 10.8 | 0.7 | 246.5 | 1025 | 577 | 966 |
| 2023 | 28.0 | 6.4 | 3.2 | 179.6 | 1026 | 624 | 1030 |
| 10 YR Norm (2011-2020) | 27.8 | 10.4 | 25.7 | 260.5 | 933 | 530 | 943 |
| FORT FRANCES | |||||||
| 2025 | 30.1 | 6.4 | 54.9 | 244.2 | 1143 | 709 | 1159 |
| 2024 | 27.7 | 9.9 | 1.9 | 309.9 | 1084 | 625 | 1052 |
| 2023 | 26.9 | 1.7 | 36.7 | 190.2 | 1195 | 786 | 1241 |
| 10 YR Norm (2011-2020) | 27.9 | 10.7 | 25.8 | 250.3 | 1052 | 631 | 1093 |
This weather summary is compiled by OMAFA using Environment Canada weather station data provided by Agriculture and Agri-Food Canada. Data quality is verified but accuracy is not guaranteed and should be used for general information purposes only. For additional locations and weather analysis, visit the OMAFA Pest and Weather System (PAWS)