
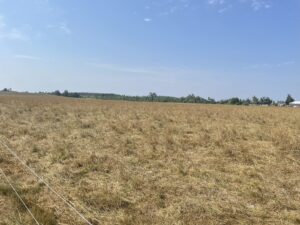
There are areas of the province that have received little effective rainfall since early June. Dry and hot growing conditions can limit regrowth in hay fields and pastures.
AgriStability compensation rate has been increased for 2025 and Agricorp has extended the deadline to apply to July 31, 2025. If you have questions about crop insurance options, call Agricorp at 1 888-247-4999, or review their website for more information (https://www.agricorp.com). Farmers can access program payments faster by following these tips:
- Report damage as soon as it is evident. The sooner damage is reported, the sooner Agricorp can help producers with the next steps.
- Report damage or yield for each crop separately, so Agricorp can process possible payments right away.
- Apply for interim AgriStability payments if experiencing financial distress.
- Consider AgriInvest to help with cash flow.
In addition to talking to Agricorp about program options, actions to reduce the negative impacts on forage crops and pastures are listed below.
Managing Forage Crops in Hot and Dry Conditions
Before
- Soil test at least once every three years and apply nutrients as outlined in OMAFA Publication 30: Guide to Forage Production.
- In perennial hay fields, establish species that tolerate dry conditions, such as alfalfa, reed canarygrass, orchardgrass, and tall fescue.
- Include warm-season crops in the farm’s forage plan, such as corn, sorghum-sudangrass, or millet.
- Consider if Forage Rainfall Insurance offered by Agricorp is the right business risk management tool to help protect your farm’s forage supply.
During
- Scout alfalfa for potato leafhoppers and act if populations exceed the threshold.
- Scout for true armyworm starting when cereal crops begin to mature, and act if populations exceed threshold and the armyworms are less than 2.5 cm (1 in.) long.
- If the alfalfa is tall enough to justify cutting and a 30- to 35-day harvest interval can be maintained, it can be cut. When rains return alfalfa will regrow from the crown.
- Do not cut red clover or birdsfoot trefoil during a drought, as this will thin the stand.
- For extra fall forage after winter wheat harvest, seed oats at 90 kg/ha (80 lbs/acre) and apply 55 kg/ha (50 lbs/acre) of nitrogen.
- Call Agricorp (1-888-247-4999) to change the purpose of cereal or grain corn crops before harvesting them as forage. Check the labels of any crop protection products applied for feeding/forage restrictions.
- Cereals before heading can be put up as baleage. Between milk and soft dough stage they can be chopped and put up in a silo (like corn silage).
- Soybeans are difficult to ensile and not recommended for boosting inventories on short notice.
- Canola and other brassicas will not store as forage.
- For extra forage in early spring, seed fall rye or winter triticale at 110 kg/ha (100 lbs/acre) after soybeans or silage corn harvest. Apply 55-80 kg/ha (50-70 lbs/acre) of nitrogen in the spring at green up.
After
- Test forages for nutritional value and nitrates. Work with a nutritionist to balance rations, dilute nitrates, and “stretch” supplies if inventory is a concern.
- Reduce storage losses:
- In dry hay by storing it off the ground or on a well-drained base and keeping it under cover (either tarped or in a shed).
- In baleage by checking the plastic for holes and promptly taping them closed. Mow grass near bales stored outside to reduce rodent pressure.
- In haylage by packing the crop to at least 80 g DM/L (15 lbs DM/ft3), and completely sealing the silo.
- Minimize feed-out losses:
- Use a feeder to reduce forage waste.
- Promptly remove spoiled feed from feeders and bunks.
- Feed dry silage in January/February to counteract heating and minimize the risk of fire.
Managing Pastures in Hot and Dry Conditions
Before
- Train all livestock to respect an electric fence.
- Soil test at least once every five years and apply nutrients to maintain results above 12 ppm P and 120 ppm K.
- Establish species that tolerate dry conditions, such as alfalfa, reed canarygrass, orchardgrass, tall fescue, and creeping red fescue.
- Implement a rotational grazing system on your farm.
- Consider if Forage Rainfall Insurance offered by Agricorp is the right business risk management tool to help protect your farm’s forage supply.
During
- If you are not rotationally grazing, start!
- Leave 7.5-10 cm (3-4 in.) of residual grass after each grazing event.
- Lengthen the amount of rest each paddock receives, so the grass plants have time to grow 4-5 new leaves before re-grazing.
- Combine groups of animals into one herd/flock.
- Increase stocking density by offering livestock less space at a time and moving them more frequently.
- Increase the number of grazed acres by using hayfield regrowth and diversifying your grazing (below).
- Feed supplemental forage on pasture before livestock run out of grass.
- If you run out of grazing, pull livestock off the pasture and feed them stored forage until the pasture has recovered.
- Diversify your grazing:
- Grain crop stubble can be good grazing for dry cows/ewes.
- Cover crops can be excellent grazing. Some species are not safe for livestock to eat, while others can pose health risks if not managed carefully. Research the species in the mix before grazing.
- Grain and oilseed crops may be grazed if the change of use is approved by Agricorp (1-888-247-4999). Check the labels of any crop protection products applied for grazing restrictions. Animal health risks increase once crops start grain fill. Research how to safely graze grain and oilseed crops before starting.
- Scout for true armyworm starting when cereal crops begin to mature, and act if populations exceed threshold and the armyworms are less than 2.5 cm (1 in.) long.
After
- Apply 55-85 kg/ha (50-75 lbs/acre) of nitrogen to grass pastures in the early fall to encourage tillering.
OMAFA Weather Summary: Thurs July 24—Wed July 30, 2025
| Location | Highest Temp (°C) | Lowest Temp (°C) | Rain for Week (mm) | Rain Since April 1st (mm) | GDD0C April 1st | GDD5C April 1st | CHU May 1st |
| HARROW | |||||||
| 2025 | 33.3 | 16.0 | 24.4 | 346.2 | 2017 | 1434 | 2077 |
| 2024 | 29.5 | 12.7 | 5.6 | 324.8 | 2145 | 1538 | 2227 |
| 2023 | 29.4 | 13.7 | 55.0 | 343.8 | 1937 | 1343 | 1985 |
| 10 YR Norm (2011-2020) | 28.0 | 16.0 | 26.6 | 377.7 | 1983 | 1380 | 2141 |
| RIDGETOWN | |||||||
| 2025 | 32.7 | 14.9 | 26.9 | 267.7 | 1918 | 1337 | 1945 |
| 2024 | 29.2 | 9.8 | 2.2 | 435.2 | 2028 | 1426 | 2092 |
| 2023 | 30.7 | 12.3 | 38.2 | 417.8 | 1841 | 1256 | 1850 |
| 10 YR Norm (2011-2020) | 27.4 | 13.8 | 34.8 | 334.8 | 1864 | 1267 | 1994 |
| SARNIA | |||||||
| 2025 | 33.8 | 16.6 | 10.5 | 393.1 | 1864 | 1289 | 1857 |
| 2024 | 30.3 | 11.9 | 5.2 | 379.4 | 2014 | 1415 | 2058 |
| 2023 | 31.9 | 15.0 | 30.3 | 306.6 | 1804 | 1219 | 1776 |
| 10 YR Norm (2011-2020) | 27.8 | 15.6 | 14.4 | 332.7 | 1825 | 1230 | 1952 |
| LONDON | |||||||
| 2025 | 32.9 | 15.9 | 21.7 | 294.4 | 1827 | 1269 | 1880 |
| 2024 | 29.3 | 11.3 | 6.0 | 470.5 | 2005 | 1399 | 2077 |
| 2023 | 29.8 | 13.0 | 72.4 | 409.5 | 1832 | 1247 | 1847 |
| 10 YR Norm (2011-2020) | 27.2 | 14.5 | 14.5 | 337.7 | 1842 | 1248 | 1975 |
| BRANTFORD | |||||||
| 2025 | 33.7 | 14.8 | 9.0 | 321.3 | 1856 | 1289 | 1865 |
| 2024 | 30.3 | 11.2 | 27.0 | 418.4 | 1953 | 1352 | 2026 |
| 2023 | 29.6 | 12.3 | 61.2 | 355.7 | 1822 | 1236 | 1836 |
| 10 YR Norm (2011-2020) | 29.5 | 14.9 | 17.6 | 299.4 | 1835 | 1245 | 1946 |
| WELLAND | |||||||
| 2025 | 31.6 | 16.9 | 11.1 | 222.3 | 1908 | 1331 | 1956 |
| 2024 | 30.6 | 12.5 | 1.0 | 392.9 | 2015 | 1411 | 2108 |
| 2023 | 29.6 | 13.0 | 77.8 | 378.7 | 1842 | 1250 | 1858 |
| 10 YR Norm (2011-2020) | 27.3 | 15.0 | 18.8 | 320.9 | 1850 | 1255 | 1987 |
| GODERICH | |||||||
| 2025 | 32.3 | 14.8 | 10.4 | 227.9 | 1743 | 1178 | 1777 |
| 2024 | 29.2 | 10.0 | 4.0 | 266.5 | 1819 | 1225 | 1866 |
| 2023 | 29.3 | 12.2 | 9.1 | 245.7 | 1688 | 1119 | 1687 |
| 10 YR Norm (2011-2020) | 25.1 | 13.3 | 19.2 | 288.3 | 1665 | 1080 | 1779 |
| ELORA | |||||||
| 2025 | 31.2 | 13.8 | 19.4 | 319.4 | 1710 | 1154 | 1740 |
| 2024 | 29.2 | 9.7 | 13.1 | 358.6 | 1816 | 1225 | 1890 |
| 2023 | 29.1 | 10.7 | 27.2 | 334.9 | 1682 | 1113 | 1687 |
| 10 YR Norm (2011-2020) | 26.2 | 12.0 | 18.9 | 335.5 | 1657 | 1076 | 1762 |
| MOUNT FOREST | |||||||
| 2025 | 32.8 | 15.6 | 21.6 | 280.2 | 1709 | 1155 | 1738 |
| 2024 | 29.9 | 9.5 | 7.7 | 340.1 | 1797 | 1210 | 1871 |
| 2023 | 28.6 | 11.8 | 28.9 | 325.6 | 1681 | 1117 | 1693 |
| 10 YR Norm (2011-2020) | 26.1 | 12.3 | 20.5 | 338.8 | 1637 | 1064 | 1759 |
| BARRIE | |||||||
| 2025 | 34.8 | 14.9 | 9.3 | 233.0 | 1706 | 1149 | 1744 |
| 2024 | 28.8 | 11.1 | 0.5 | 501.4 | 1760 | 1172 | 1844 |
| 2023 | 29.3 | 9.2 | 6.7 | 390.0 | 1666 | 1096 | 1676 |
| 10 YR Norm (2011-2020) | 26.7 | 12.9 | 16.8 | 301.0 | 1620 | 1050 | 1736 |
| PETERBOROUGH | |||||||
| 2025 | 32.5 | 11.7 | 4.4 | 247.7 | 1757 | 1191 | 1780 |
| 2024 | 30.3 | 10.6 | 6.3 | 352.9 | 1812 | 1219 | 1865 |
| 2023 | 29.5 | 8.7 | 44.1 | 344.4 | 1710 | 1128 | 1675 |
| 10 YR Norm (2011-2020) | 28.4 | 12.1 | 19.0 | 297.0 | 1682 | 1101 | 1768 |
| KEMPTVILLE | |||||||
| 2025 | 33.9 | 14.1 | 3.5 | 245.8 | 1833 | 1264 | 1874 |
| 2024 | 31.2 | 14.1 | 6.6 | 383.0 | 1910 | 1317 | 2007 |
| 2023 | 29.2 | 9.1 | 56.0 | 371.0 | 1833 | 1257 | 1826 |
| 10 YR Norm (2011-2020) | 28.9 | 13.3 | 21.0 | 327.3 | 1764 | 1184 | 1881 |
| SUDBURY | |||||||
| 2025 | 30.6 | 12.8 | 9.9 | 306.3 | 1495 | 971 | 1575 |
| 2024 | 29.4 | 10.9 | 21.1 | 419.9 | 1638 | 1075 | 1734 |
| 2023 | 28.6 | 9.4 | 36.5 | 437.5 | 1578 | 1050 | 1626 |
| 10 YR Norm (2011-2020) | 26.7 | 12.6 | 17.0 | 310.4 | 1512 | 993 | 1662 |
| EARLTON | |||||||
| 2025 | 29.8 | 9.5 | 22.2 | 325.5 | 1445 | 938 | 1533 |
| 2024 | 29.9 | 10.6 | 14.2 | 358.9 | 1614 | 1058 | 1701 |
| 2023 | 27.4 | 8.3 | 13.3 | 266.3 | 1552 | 1023 | 1595 |
| 10 YR Norm (2011-2020) | 26.4 | 10.3 | 14.7 | 281.0 | 1410 | 913 | 1553 |
| SAULT STE MARIE | |||||||
| 2025 | 29.5 | 13.0 | 0.7 | 265.9 | 1443 | 911 | 1463 |
| 2024 | 27.1 | 10.7 | 6.0 | 390.7 | 1509 | 931 | 1530 |
| 2023 | 27.3 | 9.7 | 25.3 | 285.9 | 1503 | 972 | 1512 |
| 10 YR Norm (2011-2020) | 26.0 | 9.7 | 24.8 | 321.9 | 1351 | 833 | 1425 |
| THUNDER BAY | |||||||
| 2025 | 29.0 | 9.5 | 24.9 | 336.8 | 1346 | 842 | 1441 |
| 2024 | 29.9 | 7.9 | 0.0 | 278.1 | 1417 | 863 | 1423 |
| 2023 | 31.4 | 8.2 | 12.8 | 211.5 | 1390 | 883 | 1456 |
| 10 YR Norm (2011-2020) | 26.1 | 11.0 | 16.0 | 310.0 | 1325 | 816 | 1414 |
| FORT FRANCES | |||||||
| 2025 | 31.3 | 6.4 | 3.7 | 316.7 | 1525 | 987 | 1609 |
| 2024 | 29.9 | 7.7 | 13.8 | 359.0 | 1489 | 925 | 1528 |
| 2023 | 31.5 | 6.3 | 23.1 | 253.6 | 1550 | 1036 | 1655 |
| 10 YR Norm (2011-2020) | 26.7 | 10.5 | 23.1 | 309.4 | 1451 | 925 | 1571 |
This weather summary is compiled by OMAFA using Environment Canada weather station data provided by Agriculture and Agri-Food Canada. Data quality is verified but accuracy is not guaranteed and should be used for general information purposes only. For additional locations and weather analysis, visit the OMAFA Pest and Weather System (PAWS)