Nitrogen (N)
Corn responds well to nitrogen, so adequate availability of nitrogen is critical to profitable corn production. Excess nitrogen adds unnecessary expenses and increases the risk of nitrate movement to ground water, poorer quality of surface water and production of greenhouse gases through nitrous oxide emissions. Insufficient nitrogen leads to nitrogen deficiency.
Nitrogen deficiency first appears on the lower leaves, manifested as yellowing, beginning at the tip of the leaf and proceeding down the midrib (Figure 11). [cmb1] Eventually, the yellow areas of the leaf will turn brown and die.
In young plants, potential yield loss will occur long before nitrogen deficiency symptoms appear, so yellowing is not a reliable indicator of the need for nitrogen fertilizers.
Two methods can be used to determine optimum nitrogen rates:
- Nitrate-nitrogen soil test.
- General recommendations based on: expected yield, soil type, previous crop, CHU rating for location, N fertilizer cost, corn price and application timing.
Nitrate-Nitrogen (NO3-N) Soil Test
Soils can vary greatly in their ability to supply nitrogen. The amount of nitrate-nitrogen present in the soil at planting time, or just before side-dress, can be a useful indicator of a soil’s capacity to supply nitrogen. Use of the soil test for nitrate-nitrogen should result in a more efficient and profitable use of nitrogen as well as a reduction in the risk of nitrate movement into groundwater.
Many of the factors included in the general guidelines will influence the soil nitrate levels, so the strategies for the nitrate-nitrogen soil test should be viewed as separate from the general nitrogen guidelines.
Time of Sampling
The nitrogen recommendations based on the soil test for nitrate-nitrogen were developed using samples that were taken within 5 days of planting (before or after). However, this is often an inconvenient time for sampling. Seasonal differences in weather can dramatically change the soil tests at this time of year (see Where caution is required). Alternatively, sampling when the corn is 15–30 cm (6–12 in.) tall, before the application of side-dress nitrogen, has increased in popularity. This is referred to as the pre-side-dress nitrogen test (PSNT).
By delaying sampling past the busy planting season, the PSNT allows more time for sampling and receiving results from the laboratory. More importantly, considerable evidence indicates that nitrogen recommendations based on this later sampling time are superior to those based on a planting time sample. This is particularly true when there are organic sources of nitrogen, such as manure or legumes, in the cropping system. PSNT samples taken in June detect nitrate that has mineralized from these organic sources and will more accurately reflect total available nitrogen and fertilizer nitrogen requirements.
Taking the Sample
Nitrates are more mobile than both phosphorus or potassium, so a separate, deeper, soil sample must be taken for the nitrate-nitrogen test. The soil should be sampled to a depth of 30 cm (12 in.). It is important that all cores in a field be taken to the same depth and that the sampling depth be included with the information sent with the sample to the lab.
To ensure that the sample is representative of the field, use a sampling pattern similar to that recommended for the standard soil test, described in soil sampling. Since variations in soil nitrate content can have a large impact on nitrogen fertilizer recommendations, consider sampling more intensively for nitrate than for phosphorus or potassium.
Take separate samples of:
- areas with differences in past management
- areas with distinctly different soil types
- knolls and depressions
Handling the Sample
Place soil cores in a clean plastic pail, crushed by hand and well mixed. Take about 500 g of soil (1 lb) from the pail and place it in a clean plastic bag or soil sample box.
Microbial action in the sample can change the nitrate content quickly if it is not handled properly. Chill samples as soon as possible. Freezing is not recommended as this can change nitrate levels. For shipping, pack samples with insulating material to keep them cool and send them by courier to ensure quick delivery to the lab.
Samples can also be air-dried. Spread the sample in a thin layer on a clean plastic sheet, breaking up any large lumps in the process. It should be dry in 1–2 days and can be shipped to the lab without any extra precautions. Do not dry the samples in a warm oven, as this can affect the nitrate content.
Table 1. Nitrogen Guidelines Based on Spring Nitrate-Nitrogen (NO3-N)
| Conversion Factors: To convert soil test results from kg/ha to ppm for a 30 cm (12 in.) sample, divide kg/ha by 4. For example, if the nitrate-nitrogen concentration of a sample taken from the top 30 cm (12 in.) of soil is 32 kg/ha, the nitrate nitrogen is 32 kg/ha ÷ 4 = 8 ppm. | |
| Spring Nitrate Nitrogen1 in top 30 cm (1 ft) | Actual Nitrogen Suggestion |
| 1 ppm | 211 kg N/ha |
| 2 ppm | 199 kg N/ha |
| 3 ppm | 186 kg N/ha |
| 4 ppm | 173 kg N/ha |
| 5 ppm | 161 kg N/ha |
| 6 ppm | 148 kg N/ha |
| 7 ppm | 135 kg N/ha |
| 8 ppm | 123 kg N/ha |
| 9 ppm | 110 kg N/ha |
| 10 ppm | 97 kg N/ha |
| 11 ppm | 85 kg N/ha |
| 12 ppm | 72 kg N/ha |
| 13 ppm | 59 kg N/ha |
| 14 ppm | 47 kg N/ha |
| 15 ppm | 34 kg N/ha |
| 16 ppm | 21 kg N/ha |
| 17 ppm | 9 kg N/ha |
| 18 ppm | 0 kg N/ha |
| 100 kg/ha = 90 lb/acre | |
| 1 Spring nitrate-nitrogen refers to samples taken within 5 days of planting (either before or after). | |
Where Caution is Required
Sometimes the fertilizer recommendations based on the nitrate-nitrogen soil test need to be modified. The nitrogen in manure or legumes applied or plowed down just before sampling will not have converted into nitrates and will not be detected by the soil test. Information will be provided with the test results on how to make appropriate adjustments.
The nitrate-nitrogen soil test has not been adequately evaluated for:
- legumes or manure plowed down in the late summer or fall
- areas with distinctly different soil types
- legumes in a no-till system
- soil samples taken prior to planting before the soil has warmed up significantly (i.e., in mid to late April)
In these circumstances, use the nitrate-nitrogen soil test with caution.
Table 1. Nitrogen guidelines based on spring nitrate-nitrogen and Table 2. Nitrogen guidelines based on pre-side-dress nitrate-nitrogen show the suggested application rates of nitrogen for different levels of soil nitrate-nitrogen for 30 cm (12 in.) deep samples when the nitrogen/corn price ratio is five. If the price ratio is increased to seven (i.e., the price of nitrogen fertilizer has increased or the price of corn has decreased), reduce the suggested rates by 20 kg/ha (18 lb/acre) from the rates in these tables. For more information, see Price ratio adjustment, in Appendix B.
Table 2. Nitrogen Guidelines Based on pre-side-dress Nitrate Nitrogen (NO3-N)
| Samples taken when corn is 15-30 cm (6-12 in.) tall (usually within the first 2 weeks of June). Conversion Factors: To convert soil test results from kg/ha to ppm for a 30-cm (12-in.) sample, divide kg/ha by 4. For example, if the nitrate-nitrogen concentration of a sample taken from the top 30 cm (12 in.) of soil is 32 kg/ha, the nitrate nitrogen is 32 kg/ha ÷ 4 = 8 ppm. | ||||||
| Pre-Side-dress Nitrate Nitrogen1 in top 30 cm (1 ft) | Expected Yield (t/ha) | |||||
| 7.5 t/ha (120 bu/acre) | 9.0 t/ha (143 bu/acre) | 10.5 t/ha (167 bu/acre) | 12.0 t/ha (191 bu /acre) | 13.5 t/ha (215 bu/acre) | 15.0 t/ha (239 bu/acre) | |
| 0 ppm | 197 kg N/ha | 221 kg N/ha | 244 kg N/ha | 269 kg N/ha | 293 kg N/ha | 316 kg N/ha |
| 2.5 ppm | 183 kg N/ha | 206 kg N/ha | 230 kg N/ha | 252 kg N/ha | 276 kg N/ha | 299 kg N/ha |
| 5 ppm | 169 kg N/ha | 192 kg N/ha | 214 kg N/ha | 236 kg N/ha | 259 kg N/ha | 282 kg N/ha |
| 7.5 ppm | 155 kg N/ha | 177 kg N/ha | 198 kg N/ha | 221 kg N/ha | 242 kg N/ha | 265 kg N/ha |
| 10 ppm | 141 kg N/ha | 161 kg N/ha | 183 kg N/ha | 204 kg N/ha | 225 kg N/ha | 248 kg N/ha |
| 12.5 ppm | 127 kg N/ha | 147 kg N/ha | 167 kg N/ha | 188 kg N/ha | 210 kg N/ha | 231 kg N/ha |
| 15 ppm | 111 kg N/ha | 131 kg N/ha | 151 kg N/ha | 171 kg N/ha | 193 kg N/ha | 213 kg N/ha |
| 17.5 ppm | 93 kg N/ha | 114 kg N/ha | 134 kg N/ha | 155 kg N/ha | 175 kg N/ha | 196 kg N/ha |
| 20 ppm | 64 kg N/ha | 96 kg N/ha | 118 kg N/ha | 138 kg N/ha | 158 kg N/ha | 178 kg N/ha |
| 22.5 ppm | 0 | 67 kg N/ha | 99 kg N/ha | 120 kg N/ha | 141 kg N/ha | 161 kg N/ha |
| 25 ppm | 0 | 0 | 71 kg N/ha | 101 kg N/ha | 123 kg N/ha | 143 kg N/ha |
| 27.5 ppm | 0 | 0 | 0 | 74 kg N/ha | 103 kg N/ha | 124 kg N/ha |
| 30 ppm | 0 | 0 | 0 | 0 | 76 kg N/ha | 104 kg N/ha |
| 32.5 ppm | 0 | 0 | 0 | 0 | 0 | 77 kg N/ha |
| 35 ppm | 0 | 0 | 0 | 0 | 0 | 0 |
| 100 kg/ha = 90 lb/acre | ||||||
Laboratories
See Appendix C, Accredited soil-testing laboratories in Ontario, for a list of laboratories that are accredited to analyze soil samples for nitrate-nitrogen.
General Nitrogen Rate Guidelines for Corn (Metric)
The figures in this worksheet are based on a review of N response trials from 1961–2004 and make up the Nitrogen Calculator, which is simple to use and can be found online under “Tools for Corn Growers” at www.fieldcropnews.com. The fertilizer rates calculated here are designed to produce the highest economic yield when accompanied by good or above-average management. Research shows that higher rates will occasionally produce higher yields, but usually not enough to pay for the additional fertilizer.
A version of the worksheet using Imperial measure, as well as notes that explain each section can be found in Appendix B, Corn nitrogen rate worksheet (imperial) with detailed explanation.
Replace worksheet with one from the table list.
| Base N Requirement (choose from Table A) | _________ |
| Yield Adjustment (Yield (T/ha) _____ x 13.6) = | + _______ |
| Heat Unit Adjustment Your CHU-M1s = ___________ Less – 2,800 Total = ________ x 0.041 = | + _______ |
| Previous Crop Adjustment (Choose from Table D) | – _______ |
| Price Ratio (PR) Adjustment for Nitrogen Relative to Corn Price (Choose from Table E) | – _______ |
| Suggested Total N (A+B+C–D–E) | = _______ |
| Deduct Starter N | – _______ |
| Deduct Manure N Credits1 | – _______ |
| Preplant Additional N (F–G–H) | = _______ |
| OR | |
| Side-dress Additional N (If Additional N is applied side-dress, multiply value I by the appropriate value in Table J) | _________ |
| 1 Manure N Credits can be found in Chapter 9, Soil Fertility and Nutrient Use. | |
Table A. Base N Requirement (kg/ha)
| Soil Texture | Base N Requirement | |
| Southwestern and Central Ontario | Eastern Ontario* | |
| Clay, heavy clay | 53 | 1 |
| Clay loam | 40 | 1 |
| Loam | 32 | 1 |
| Loamy sand | 46 | 19 |
| Sandy loam | 38 | 19 |
| Sand | 52 | 19 |
| Sandy clay, sandy clay loam | 43 | 19 |
| Silt loam | 20 | 1 |
| Silty clay loam | 36 | 1 |
| Silty clay | 49 | 1 |
| * Eastern Ontario includes Frontenac, Renfrew and counties to the east of them. | ||
Table D. Previous Crop Adjustments
| Previous Crop | Adjustment (kg/ha) |
| Grain Corn | 0[AV2] |
| Silage Corn | 14 |
| Cereals | 12 |
| Soybeans | 30 |
| Dry edible beans | 30 |
| Clover cover crop (plowed) | 82 |
| Clover cover crop (no-till) | 67 |
| Perennial Forages | |
| Less than one-third legume | 0 |
| One-third-to-half legume | 55 |
| Over half legume | 110 |
Table E. Price Ratio (PR) Adjustment for Nitrogen Relative to Corn Price
| Corn Price | Nitrogen Price ($/kg N) | |||||
| $1.00 | $1.25 | $1.50 | $1.75 | $2.00 | $2.25 | |
| $120/t | 22 | 36 | 50 | 64 | 78 | * |
| $130/t | 18 | 31 | 44 | 57 | 70 | 82 |
| $140/t | 14 | 26 | 38 | 50 | 62 | 74 |
| $150/t | 11 | 22 | 34 | 45 | 56 | 67 |
| $160/t | 8 | 19 | 29 | 40 | 50 | 61 |
| $170/t | 6 | 16 | 26 | 35 | 45 | 55 |
| $180/t | 4 | 13 | 22 | 32 | 41 | 50 |
| $190/t | 2 | 11 | 19 | 28 | 37 | 46 |
| $200/t | 0 | 8 | 17 | 25 | 34 | 42 |
| *Adjustments for these price ratios have not been assessed. | ||||||
Table J. Additional N at Sidedress – Timing Adjustment (southwestern and central Ontario only)
| Soil Texture | Adjustment kg/ha |
| Clay, clay loam, loam, silt loam, silty clay, silty clay loam | 0.8 |
| Sandy clay, sandy clay loam, sandy loam | 0.9 |
| Sand, loamy sand | 1.0 |
Nitrogen Application
The major portion of the nitrogen should be applied in the spring as pre-plant, pre-emergence or side-dressed before the corn is 30 cm (12 in.) high. Fall application is not advised due to the potential for high losses (e.g., leaching, volatilization, runoff, nitrous oxide).
A portion of the nitrogen may be applied in a band at planting. Ensure that safe rates of fertilizer near the seed are not exceeded, see Table 9-24. Maximum safe rates of nutrients in fertilizer. [BR3] Where it is desirable to apply high rates of nitrogen at planting, it should be placed in a separate band greater than 10 cm (4 in.) from the seed row.
Anhydrous ammonia, applied with conventional equipment, should be placed a minimum of 15 cm (6 in.) deep in the soil. For pre-plant applications, applicator outlets should be no more than 50 cm (20 in.) apart. For wider spacing, a 4-day waiting period before planting is recommended to avoid damage to seedlings.
When appropriate equipment is used, ammonia may be applied with a cultivator or disc, a minimum of 10 cm (4 in.) deep with the ammonia outlets spaced no more than 50 cm (20 in.) apart.
Protecting Nitrogen from Loss
There are three key factors that contribute to losses of N when applied as fertilizer:
- Volatilization from surface applied urea or urea-containing fertilizers.
- Early season leaching or dentrification of N when it is in the nitrate (NO3) form.
- Late season N losses from residual N when supply exceeds crop demand.
To reduce urea volatilization, the most common approach is to incorporate or inject the fertilizer so that soil particles trap the ammonia that might volatilize. Generally, thorough field cultivation or discing (1 pass) is enough to virtually eliminate volatilization from surface applied granular urea. If the urea source is UAN (28% or 32% solutions) the risk of volatilization is less than granular urea and, in most cases, a shallow tillage practice such as a vertical tillage pass can eliminate most of the volatilization risk.
Additives (e.g., active ingredient NBPT) to urea that block the urease enzyme can also protect urea from volatilization losses for a significant period of time.
Risk from early season leaching or denitrification is generally caused by wet soils; either sandy soils that leach N or saturated conditions that cause denitrification in heavy soils. The key strategy to reduce these two forms of loss is to reduce the size of the nitrate pool in the soil prior to any significant crop uptake. This can be done by delaying application of the N, or by using an N fertilizer product that has a slower release profile, such as coated products that physically delay the release of N or fertilizer additives that slow the conversion to nitrate.
Reducing late season N losses hinges on applying fertilizer N at rates very close to the total crop demand so that post-harvest residual nitrate concentration in the soil is low.
Nitrogen Strategies
Successful nitrogen application strategies hinge on applying a rate of fertilizer N that closely matches the net difference between the N supply (soil organic matter, previous crop residues, manure, etc.) and the N demand by the crop. The OMAFA general guidelines (see worksheet section in appendix?) for N use a significant number of factors to predict, on average, the net N requirement for a given field.
Some other factors that can contribute to an improved understanding of seasonal supply and demand are:
- total rainfall in the April 10 to June 10 period
- CHU accumulation
- yield potential based on plant stand and early growth
- crop imagery (i.e., Normalized Difference Vegetative Index (NDVI) which attempts to define the colour and size of the crop and potential N status)
Producers must move away from a system where the entire N is applied in the planting window, in order to integrate seasonal inputs and general recommendations into an enhanced nitrogen strategy. An enhanced N strategy demands that planting time N applications are reduced such that there is an opportunity to make improved decisions on what rate is best for the remainder of the N supply.
Split applications, where some of the N is applied at planting and the rest is applied at side-dress (V5 or later) will often reduce the total N required and improve profitability. However, the real advantage to a split application strategy does not come from simply splitting the total N rate into two unique application windows, but from splitting and making more informed rate decisions in the second application window. For example, research from the University of Guelph and OMAFA demonstrated that in three rather unique growing seasons a strategy of 111 kg/ha (100 lb/acre) at planting followed by 56 kg/ha (50 lb/acre) at side-dress (V6) was modestly superior to a plan of applying 168 kg/ha (150 lb/acre) all at planting. Significantly better results were obtained, however, if following the 111 kg/ha (100 lb/acre) rate at planting, the side-dressed rates could be adjusted from 0–90 kg/ha (0–80 lb/acre) depending on the seasonal cues of rainfall, soil nitrates, etc.
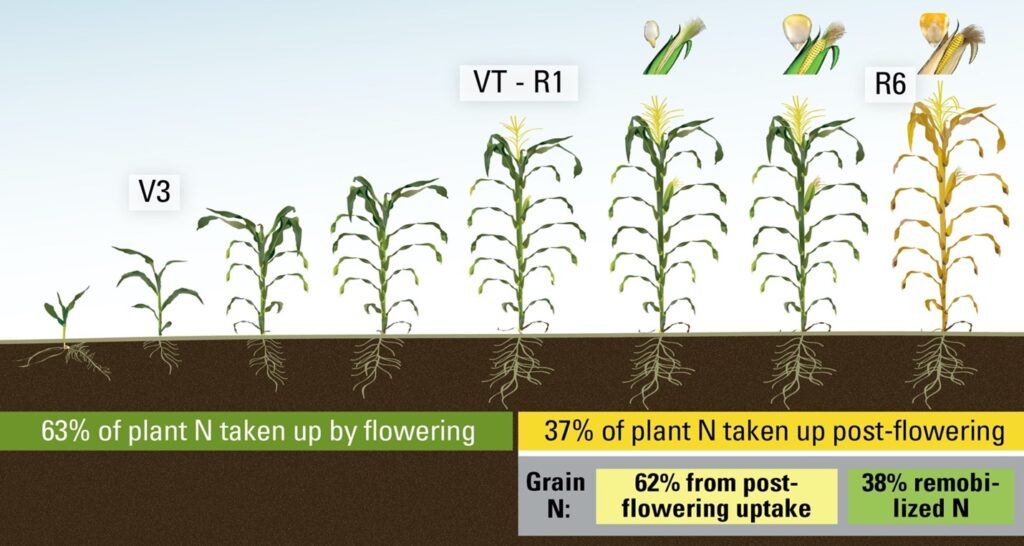
High clearance application equipment that is now more prominent in Ontario allows for applications of N to take place right up to tassel stage. This widens the window for gathering seasonal cues to determine N rates and reduces the risk of the corn getting too tall for conventional tractor drawn side-dress equipment. Research in the U.S. cornbelt has re-defined the amount of N that is taken up by the plant after VT, as illustrated in Figure 2. Nitrogen uptake at various stages of corn development. The need for nitrogen to be taken up by the corn plant in the post-silking window is evident. However, producers should be reminded of several key issues that relate to late season applications:
- If nitrogen was applied earlier and has not been lost from the soil matrix from leaching or denitrification, it will be available to feed the crop post-silking.
- So far, there is limited research that suggests any positive yield response to “newly applied N” in the late side-dress window (V10 to tassel).
- Late applications of N that are applied to the soil surface or banded at very shallow depths (<5 cm) may not receive sufficient rainfall to be carried into the soil matrix and be taken up by corn roots.
- If applications are targeted to this late window, adequate N must be applied at planting to carry the crop until the later N is applied; this might range from 67-112 kg/ha (60-100 lb/acre).
Figure 2. Nitrogen Uptake at Various Stages of Corn Development. (Courtesy DuPont Pioneer)