
Optimizing Winter Wheat Quality at Harvest
Fusarium Head Blight Management
With frequent rain events in some areas as winter wheat matures, managing fusarium head blight (FHB) fungus is crucial to prevent yield loss, reduce mycotoxin contamination, and maximize grain quality.
Identification
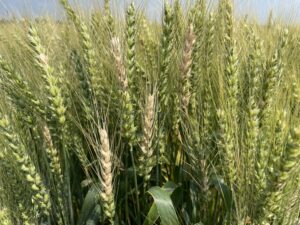
FHB symptoms are noticeable soon after flowering. Diseased spikelets (glumes and florets) appear to have ripened prematurely (bleached) in contrast to healthy, green heads (Figure 1). The fungus may attack all or part of the head. FHB symptoms can occur under favourable conditions 3 to 5 days after infection which later leads to bleached heads. The entire head may be killed when the peduncle (the stem immediately below the head) is infected. During warm, humid weather, the fungus produces a salmon-orange-to-pink ring of spores at the base of the spikelet or in the crease of the kernel. If conditions continue, the infection may spread to adjacent kernels. Infected kernels are usually shrunken, wrinkled and light in weight. These kernels have a rough, scabby appearance and range in colour from light brown to pink to greyish-white. The timing of infection and the weather conditions during infection influence how much fusarium is present.
Assessing Risk for FHB and DON Before Harvest
Winter wheat is most susceptible to FHB infection during the flowering period. Spores are carried from infected crop residue by wind or rain and splash onto the wheat head. Rainfall or heavy dew during this period causes the spores to germinate and infect florets on the wheat head. Given the prolonged wet conditions in many areas this growing season, the risk for infection may be higher than normal.
If a wheat crop was planted after corn or wheat, or a susceptible variety was planted, the risk of FHB infection is greater. To determine the susceptibility of a variety please visit www.GoCrops.ca. Fields that are lodged are also at greater risk. Research from Nakajima and colleagues in 2008 found that DON levels were increased by 27 to 51% at harvest in wheat that was lodged for just 5 days before harvest compared to wheat that did not lodge. The DON levels were even higher in wheat lodged for more than 5 days before harvest.
To maximize grain quality and minimize DON, assess the level of infection in winter wheat fields before harvest. To conduct an assessment, blindly grab 10 heads and count the number of heads with any level of infection to give the percent incidence (e.g. 1 head out of 10 infected = 10% incidence). From there the percent severity can be estimated by looking at how much of the head is infected (e.g. 6 spikelets infected out of 22 = 27% severity). The incidence is then multiplied by the severity and is divided by 100 (e.g. 10 x 27 = 270/100 = 2.7 Fusarium Head Blight (FHB) Index. Repeat this process at 10 locations in the field to arrive at a field level FHB Index. In work published by Falk and colleagues in 2008, a Fusarium Index of 3 could result in DON levels > 6 ppm (parts per million) in a high-pressure fusarium year. If fields have an FHB Index greater than 2, they should be harvested first.
Harvest Management
Prioritize fields with high FHB Index scores for harvest. Harvest should begin as soon as the combine is able to thresh the crop (even above 20% moisture). Fusarium can continue to grow whenever grain moisture is above 19%. Toxin levels can almost double with one rainstorm (Johnson, 2004). One caveat is that above 18% moisture some combines have difficulty blowing out the lighter fusarium-damaged kernels. Growers must then decide whether to wait and risk further disease spread, or combine, dry, and remove small kernels with aspiration.
Pre-harvest Sprouting and Falling Number Management
What is a falling number?
Falling number is a standardized testing method for determining the amount of sprout damage in wheat. Wheat is ground and mixed with water in a test tube to create a slurry. The test tube is heated for 60 seconds, and a plunger is dropped. The plunger is timed to see how long it takes to fall to the bottom of the tube or a specified distance and this number (in seconds) is the falling number.
Wheat is considered sound and satisfactory for most milling and baking processes with a falling number of about 300 seconds; however, levels as low as 250 can be acceptable to end users. While growers are given a grade based on sprouts, mills are increasingly looking at falling numbers as an indicator of wheat quality. As a result, growers are encouraged to review all contracts to ensure they are aware of falling number or any other quality requirements upon delivery of grain.
What causes low falling numbers?
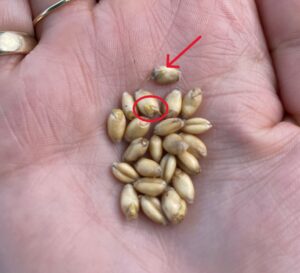
The two main causes of low falling numbers in wheat are pre-harvest sprouting and late maturity alpha-amylase (LMA) production. Pre-harvest sprouting can be initiated by cool, rainy conditions once wheat has reached physiological maturity (Figure 2). When there are multiple rain delays, there is a greater risk for sprouting, even for varieties with good sprouting resistance. When pre-harvest sprouting occurs, alpha-amylase is produced which converts starch into sugars that fuel seedling growth.
In addition to sprouting, low falling numbers can also be caused by late maturity alpha-amylase (LMA). LMA production is triggered by cold or heat shock during the later stages of maturity (26 to 30 days after pollen shedding). The specific temperature swing needed to induce LMA is not yet clear.
How can low falling numbers be prevented or managed?
The best defense against sprouting and low falling numbers is to harvest wheat as quickly as possible once it reaches maturity. Harvesting early and drying your grain is the most effective means of avoiding sprouting. Previous Ontario research showed that when harvest was delayed by two weeks the amount of sprouted wheat increased by almost 10% and yield was reduced by almost 4 bushels/acre (Table 1).
Table 1. The impact of delayed harvest on sprouts in winter wheat. Johnson et al. 2011.
| Harvest Date | Yield (bu/ac) | Test Weight (lb/bu) | Sprouts (%) |
| July 13 | 92.4 | 62.0 | 0.0 |
| July 18 | 91.8 | 61.3 | 0.0 |
| July 21 | 91.7 | 60.4 | 2.3 |
| August 1 | 88.7 | 57.8 | 8.8 |
Selecting pre-harvest sprouting resistant wheat varieties can also help reduce risks. Red wheat tends to be more tolerant than soft white wheat. When planting soft white wheat, plant no more than what can be harvested in one day to help avoid falling number issues. Avoid mixing wheat with low and high falling numbers. This will not result in better falling number. Sprouted wheat or wheat with a low falling number should be kept separate from sound wheat. If storing wheat on-farm for later shipment, consider submitting a grain sample to a wheat testing lab for falling number analysis.
Can sprouted seed be saved?
One of the common questions or concerns when sprouting does occur is whether sprouted wheat can be saved and seeded in the fall. The answer to that is – it depends. Literature shows that if there are more than 5% sprouts, the seed cannot be saved. If there are less than 5% sprouts and most of the seed is only slightly swollen it can be saved. However, it is difficult to know the impact on germination and vigor so a germination test must be conducted on the saved seed. The viability of sprouted seed almost always declines during storage so a germination test should be conducted just prior to seeding.
Seeding rates should be increased to compensate for lower germination and vigor. Given the reduced vigor, planting depth should be no more than 1 inch and a seed treatment should be considered. Use sprouted seed in earliest planted fields to help avoid a prolonged or delayed emergence as growing degree day accumulations begin to slow.
OMAFA Weather Summary: Thurs July 10—Wed July 16, 2025
| Location | Highest Temp (°C) | Lowest Temp (°C) | Rain for Week (mm) | Rain Since April 1st (mm) | GDD0C April 1st | GDD5C April 1st | CHU May 1st |
| HARROW | |||||||
| 2025 | 32.0 | 16.5 | 11.5 | 306.5 | 1699 | 1186 | 1685 |
| 2024 | 29.2 | 17.2 | 51.3 | 318.9 | 1848 | 1312 | 1859 |
| 2023 | 28.6 | 15.5 | 30.0 | 273.7 | 1631 | 1107 | 1604 |
| 10 YR Norm (2011-2020) | 28.0 | 16.7 | 13.4 | 337.0 | 1663 | 1131 | 1745 |
| RIDGETOWN | |||||||
| 2025 | 32.5 | 15.6 | 11.2 | 240.0 | 1614 | 1104 | 1585 |
| 2024 | 29.0 | 14.7 | 90.1 | 431.2 | 1746 | 1213 | 1749 |
| 2023 | 28.0 | 12.1 | 20.1 | 348.3 | 1548 | 1032 | 1492 |
| 10 YR Norm (2011-2020) | 27.9 | 14.7 | 20.2 | 282.1 | 1561 | 1034 | 1623 |
| SARNIA | |||||||
| 2025 | 32.1 | 16.7 | 90.7 | 367.7 | 1562 | 1057 | 1490 |
| 2024 | 30.5 | 14.4 | 148.3 | 373.2 | 1726 | 1196 | 1701 |
| 2023 | 30.0 | 12.3 | 38.8 | 251.8 | 1501 | 987 | 1404 |
| 10 YR Norm (2011-2020) | 28.0 | 15.9 | 11.1 | 299.9 | 1515 | 990 | 1566 |
| LONDON | |||||||
| 2025 | 31.2 | 15.6 | 6.9 | 265.3 | 1529 | 1040 | 1527 |
| 2024 | 29.8 | 15.5 | 159.7 | 463.0 | 1720 | 1184 | 1731 |
| 2023 | 27.9 | 12.4 | 29.4 | 325.7 | 1539 | 1024 | 1486 |
| 10 YR Norm (2011-2020) | 28.2 | 15.1 | 14.0 | 303.0 | 1538 | 1014 | 1600 |
| BRANTFORD | |||||||
| 2025 | 32.5 | 14.9 | 16.5 | 308.5 | 1554 | 1057 | 1515 |
| 2024 | 29.7 | 15.7 | 141.2 | 389.8 | 1664 | 1134 | 1680 |
| 2023 | 27.7 | 12.5 | 15.5 | 285.9 | 1531 | 1015 | 1482 |
| 10 YR Norm (2011-2020) | 30.7 | 15.1 | 18.7 | 270.6 | 1521 | 1001 | 1570 |
| WELLAND | |||||||
| 2025 | 32.5 | 17.2 | 0.2 | 207.7 | 1602 | 1095 | 1591 |
| 2024 | 29.2 | 16.8 | 84.6 | 391.6 | 1725 | 1191 | 1755 |
| 2023 | 27.4 | 14.1 | 23.1 | 286.1 | 1543 | 1022 | 1485 |
| 10 YR Norm (2011-2020) | 28.0 | 15.4 | 9.7 | 290.9 | 1542 | 1018 | 1606 |
| GODERICH | |||||||
| 2025 | 32.2 | 15.5 | 0.2 | 216.3 | 1467 | 972 | 1442 |
| 2024 | 27.9 | 13.9 | 60.9 | 261.5 | 1550 | 1027 | 1537 |
| 2023 | 27.2 | 10.3 | 53.9 | 217.0 | 1405 | 907 | 1332 |
| 10 YR Norm (2011-2020) | 25.8 | 14.2 | 8.7 | 250.2 | 1383 | 868 | 1425 |
| ELORA | |||||||
| 2025 | 30.4 | 13.7 | 10.6 | 280.7 | 1430 | 944 | 1408 |
| 2024 | 27.9 | 13.8 | 81.4 | 341.9 | 1550 | 1028 | 1569 |
| 2023 | 26.6 | 10.0 | 51.0 | 270.0 | 1411 | 912 | 1357 |
| 10 YR Norm (2011-2020) | 26.8 | 13.0 | 15.6 | 301.3 | 1376 | 866 | 1420 |
| MOUNT FOREST | |||||||
| 2025 | 30.5 | 14.6 | 0.3 | 247.7 | 1426 | 943 | 1399 |
| 2024 | 27.8 | 13.6 | 86.0 | 329.8 | 1534 | 1017 | 1553 |
| 2023 | 26.0 | 10.3 | 39.1 | 291.6 | 1407 | 913 | 1355 |
| 10 YR Norm (2011-2020) | 26.4 | 13.0 | 16.8 | 298.8 | 1358 | 855 | 1416 |
| BARRIE | |||||||
| 2025 | 32.3 | 13.7 | 0.0 | 222.0 | 1420 | 934 | 1411 |
| 2024 | 28.2 | 14.5 | 106.5 | 496.7 | 1494 | 976 | 1523 |
| 2023 | 27.5 | 11.0 | 67.8 | 359.3 | 1393 | 893 | 1345 |
| 10 YR Norm (2011-2020) | 26.8 | 13.2 | 12.6 | 272.3 | 1337 | 837 | 1390 |
| PETERBOROUGH | |||||||
| 2025 | 32.4 | 13.1 | 29.0 | 232.2 | 1466 | 970 | 1446 |
| 2024 | 29.6 | 13.6 | 51.3 | 346.6 | 1534 | 1011 | 1538 |
| 2023 | 29.2 | 9.5 | 59.4 | 264.6 | 1437 | 926 | 1351 |
| 10 YR Norm (2011-2020) | 28.0 | 12.6 | 9.0 | 267.1 | 1395 | 884 | 1426 |
| KEMPTVILLE | |||||||
| 2025 | 33.6 | 14.5 | 1.8 | 227.6 | 1536 | 1037 | 1529 |
| 2024 | 31.0 | 17.0 | 55.7 | 375.2 | 1620 | 1097 | 1656 |
| 2023 | 31.0 | 13.2 | 55.3 | 301.2 | 1538 | 1032 | 1466 |
| 10 YR Norm (2011-2020) | 28.3 | 14.4 | 13.4 | 291.5 | 1464 | 954 | 1518 |
| SUDBURY | |||||||
| 2025 | 30.5 | 12.4 | 23.9 | 257.6 | 1238 | 784 | 1271 |
| 2024 | 29.0 | 13.0 | 15.2 | 377.5 | 1377 | 884 | 1418 |
| 2023 | 27.1 | 9.8 | 14.9 | 369.4 | 1320 | 861 | 1313 |
| 10 YR Norm (2011-2020) | 26.9 | 12.5 | 20.5 | 279.9 | 1234 | 785 | 1322 |
| EARLTON | |||||||
| 2025 | 28.9 | 12.0 | 45.4 | 281.9 | 1192 | 755 | 1235 |
| 2024 | 30.4 | 11.0 | 7.3 | 335.3 | 1364 | 877 | 1409 |
| 2023 | 27.9 | 9.7 | 5.2 | 241.5 | 1306 | 847 | 1302 |
| 10 YR Norm (2011-2020) | 26.3 | 11.2 | 14.7 | 247.9 | 1147 | 720 | 1236 |
| SAULT STE MARIE | |||||||
| 2025 | 28.8 | 12.5 | 21.9 | 251.0 | 1184 | 723 | 1153 |
| 2024 | 26.4 | 11.3 | 10.0 | 373.5 | 1255 | 747 | 1217 |
| 2023 | 25.4 | 9.9 | 23.9 | 236.8 | 1251 | 790 | 1202 |
| 10 YR Norm (2011-2020) | 26.1 | 9.8 | 11.0 | 273.7 | 1094 | 646 | 1114 |
| THUNDER BAY | |||||||
| 2025 | 30.0 | 7.6 | 16.3 | 258.3 | 1077 | 644 | 1120 |
| 2024 | 31.6 | 7.6 | 31.0 | 277.5 | 1160 | 677 | 1122 |
| 2023 | 26.3 | 6.0 | 4.3 | 183.9 | 1137 | 700 | 1158 |
| 10 YR Norm (2011-2020) | 26.7 | 11.1 | 17.3 | 277.8 | 1063 | 624 | 1099 |
| FORT FRANCES | |||||||
| 2025 | 28.4 | 7.5 | 20.8 | 265.0 | 1274 | 806 | 1317 |
| 2024 | 30.4 | 9.9 | 28.9 | 338.8 | 1223 | 729 | 1215 |
| 2023 | 25.7 | 6.0 | 4.2 | 194.4 | 1299 | 855 | 1357 |
| 10 YR Norm (2011-2020) | 26.8 | 11.3 | 17.7 | 268.0 | 1187 | 730 | 1256 |
This weather summary is compiled by OMAFA using Environment Canada weather station data provided by Agriculture and Agri-Food Canada. Data quality is verified but accuracy is not guaranteed and should be used for general information purposes only. For additional locations and weather analysis, visit the OMAFA Pest and Weather System (PAWS)