Maximizing Rainfall Capture Through Soil Management
The amount of rainfall that makes its way into soil, instead of running off, matters to maximize crop yields – especially in dry years. Thunderstorms often bring large amounts of water quickly, and not all soils perform equally in the time it takes to soak in for use by the crop.
A recent Southwest Crop Diagnostic Days session showed the impact that management has on water infiltration – this report will share the highlights.
One soil type, four management histories
In early July, four Brookston clay loam soils were assessed at the University of Guelph Ridgetown campus across a 450-foot transect. They included four contrasting management: 1) undisturbed fencerow (reference); 2) alfalfa and manure for the last several years; and plots from the long-term crop rotation and tillage system trial: 3) corn-soybean-winter wheat with under-seeded red clover under no-till/strip-till, and 4) continuous soybeans under fall plow tillage.
In-field assessments
Two simple assessments on water infiltration and soil structure were performed to gauge the ability of each soil to absorb big rains. The four soils showed drastic differences.
Water infiltration
Water infiltration is a key measure of soil health and function, and impacts crop yields. The ability of a soil to capture a high percentage of summer thunderstorm-based rains – and avoid water ponding and erosion – is critical to supporting high-yielding crops.
Table 1 shows the time it took for two inches of water to soak into each of the four soils, using a ring of PVC pipe inserted into the soil surface. The impact of management and differences in soil structure was obvious. The fencerow soil was dark and granular-structured, and absorbed the water rapidly, while the dense soil of the continuous soybeans absorbed the water painstakingly slow and showed potential for ponding (Figure 1). The soils managed with small grains, perennials, and reduced tillage performed well and demonstrated their capacity to absorb a large rain event.
Table 1. Water infiltration times for demonstration soils at Ridgetown, July 2025.
| Management history | Time (first inch) | Time (second inch) | |
| 1 | Fencerow (reference) | 7 seconds | 8 seconds |
| 2 | Alfalfa + manure | 36 seconds | 1 minute 12 seconds |
| 3 | Corn-soy-wheat (red clover) – no-till/strip-till | 25 seconds | 1 minute 11 seconds |
| 4 | Continuous soybeans – fall plow tillage | 6 minutes 30 seconds | >20 minutes |

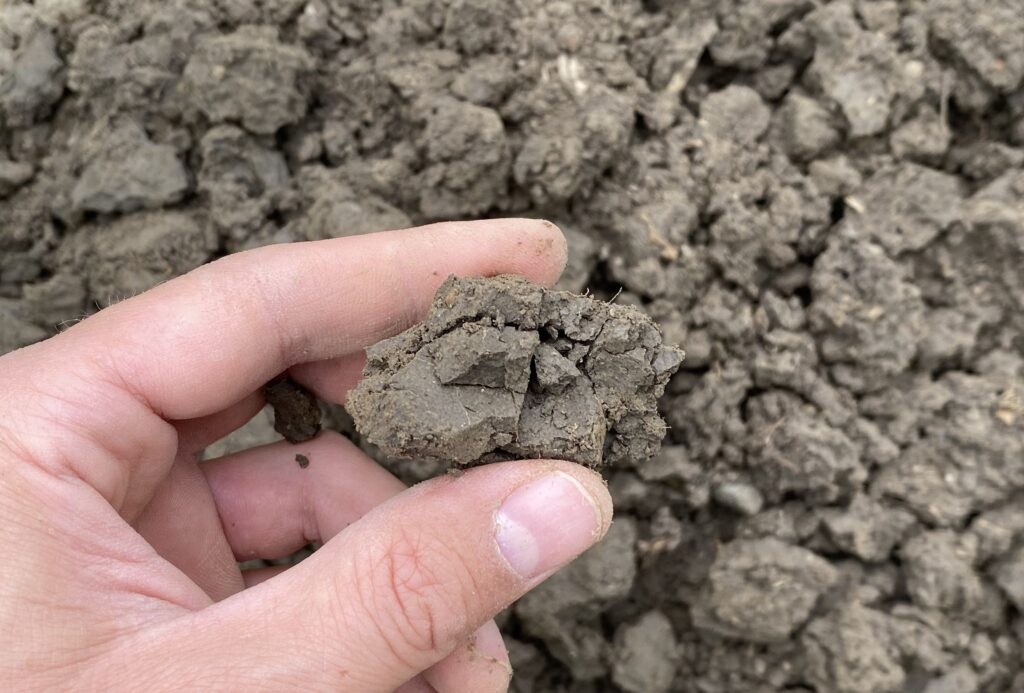
Soil structure
A well-structured soil has plenty of pore spaces and improves water infiltration, air exchange, and crop rooting. On the other hand, a cloddy, dense, or compacted soil results in ponding, increased nutrient losses, and restricted root systems (Figure 2).
Participants at Diagnostic Days saw a crumb-like structure with small, rounded aggregates in the fencerow soil and large blocks with sharp edges and few pores from the continuous soybean soil. The alfalfa and wheat-based sites had ‘intermediate soil structure” with good drainage. Cereals, perennial forages, and cover crops help build soil structure, and excessive tillage breaks it down, so these observations were expected. Many participants were surprised at how similar the soil structure was between the alfalfa and wheat-based rotations.
To assess soil structure, begin by looking at the soil surface. Is it rough, with evidence of residue and earthworm activity, or does it show crusting, which occurs when soil particles break apart during rainfall and silt and clay settle on top?
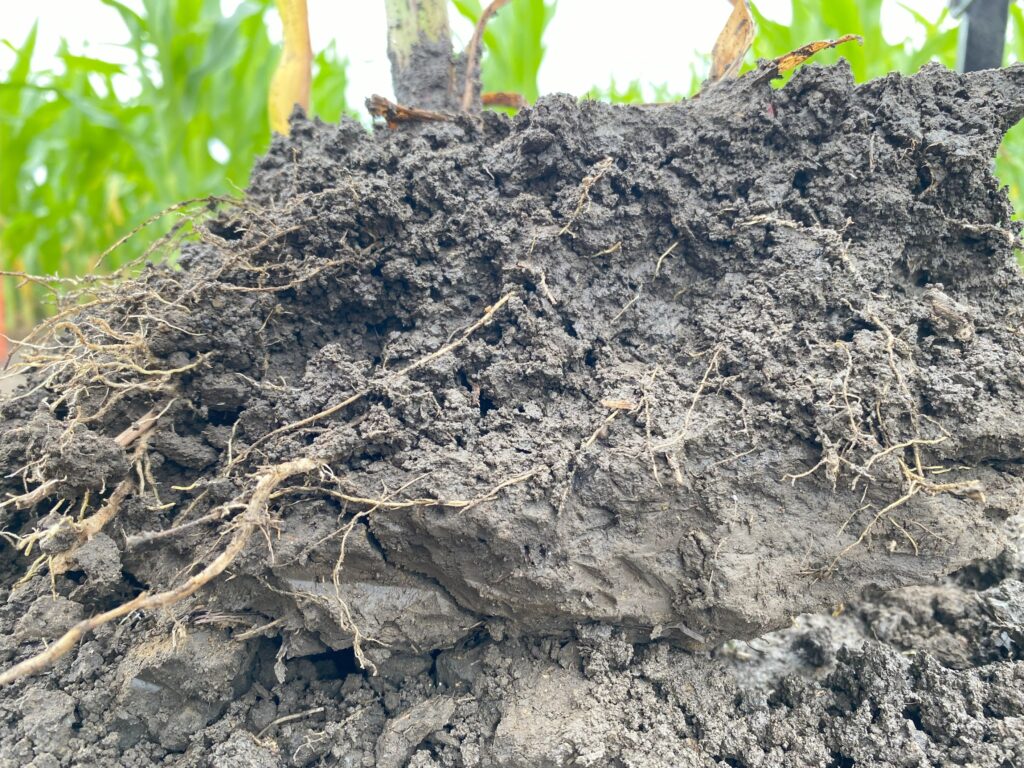
Next, look at the soil aggregates in the top six inches: are they small and rounded with plenty of air spaces and roots, or are they dense and blocky (Figure 2)? Structure will be best in the top few inches of topsoil but pore spaces and roots within them should be found readily below that depth.
Finally, don’t forget to check for compacted layers or “tillage pans”, which can occur at common tillage depths and restrict crop rooting (Figure 3). Use a tile probe, penetrometer, or even a standard soil probe to check for them. For more detailed instructions to assess soil structure, including a short video, visit Field Crop News.
Soil health testing
There are lab-based methods that can quantify soil health and provide results relating to a soil’s ability to infiltrate big rains. Research by Dr. Laura Van Eerd at the University of Guelph has found that a combination of sustainable soil management practices, like adding perennials, winter wheat, or cover crops in rotation, increases soil health scores and improves crop yields and resilience. In many cases, enhanced soil health means greater available water for high-yielding crops.
Evaluate soil health this season
Late summer is a good time to get a hands-on accounting of soil health. Dig into wheat stubble or assess problem areas in growing crops with a shovel and tile probe.
Want to dig deeper? OMAFA’s Soil Health Assessment and Plan (SHAP) enables participating farmers to submit soil samples and receive soil health scores ranked against a robust provincial database. There is a limited number of free soil health tests still available in 2025 through Soils at Guelph’s SHAP Ground-Truthing Project. Learn more here.
For a video summary of the Diagnostic Days session from Ridgetown, visit Real Agriculture’s soil school webpage.
Authored by OMAFA’s field crop unit with contribution from Dr. Laura Van Eerd, University of Guelph, Ridgetown Campus.
OMAFA Weather Summary: Thurs July 31 – Aug 6, 2025
| Location | Highest Temp (°C) | Lowest Temp (°C) | Rain for Week (mm) | Rain Since April 1st (mm) | GDD0C April 1st | GDD5C April 1st | CHU May 1st |
| HARROW | |||||||
| 2025 | 27.7 | 12.2 | 22.8 | 369.0 | 2157 | 1539 | 2251 |
| 2024 | 30.9 | 16.4 | 54.5 | 379.3 | 2312 | 1671 | 2433 |
| 2023 | 27.2 | 13.0 | 14.2 | 358.0 | 2084 | 1455 | 2170 |
| 10 YR Norm (2011-2020) | 28.1 | 16.4 | 10.5 | 388.2 | 2137 | 1500 | 2334 |
| RIDGETOWN | |||||||
| 2025 | 26.8 | 8.8 | 10.3 | 278.0 | 2051 | 1435 | 2106 |
| 2024 | 30.3 | 13.6 | 48.0 | 483.2 | 2187 | 1550 | 2285 |
| 2023 | 27.4 | 11.0 | 5.8 | 423.6 | 1978 | 1358 | 2020 |
| 10 YR Norm (2011-2020) | 27.4 | 14.7 | 27.5 | 362.3 | 2010 | 1378 | 2174 |
| SARNIA | |||||||
| 2025 | 29.1 | 10.8 | 0.5 | 393.6 | 2002 | 1392 | 2027 |
| 2024 | 30.4 | 15.2 | 30.1 | 409.5 | 2175 | 1541 | 2259 |
| 2023 | 29.4 | 13.7 | 22.8 | 329.4 | 1944 | 1325 | 1951 |
| 10 YR Norm (2011-2020) | 27.6 | 15.5 | 23.8 | 356.4 | 1974 | 1344 | 2138 |
| LONDON | |||||||
| 2025 | 29.5 | 9.3 | 3.8 | 298.2 | 1966 | 1372 | 2045 |
| 2024 | 30.8 | 14.7 | 30.7 | 501.2 | 2167 | 1527 | 2278 |
| 2023 | 27.8 | 10.5 | 15.5 | 425.0 | 1969 | 1349 | 2016 |
| 10 YR Norm (2011-2020) | 27.5 | 14.4 | 17.8 | 355.5 | 1990 | 1361 | 2157 |
| BRANTFORD | |||||||
| 2025 | 29.1 | 7.9 | 5.3 | 326.6 | 1995 | 1393 | 2029 |
| 2024 | 31.3 | 15.3 | 12.7 | 431.1 | 2115 | 1479 | 2226 |
| 2023 | 27.0 | 9.3 | 3.7 | 359.4 | 1954 | 1333 | 1997 |
| 10 YR Norm (2011-2020) | 28.9 | 14.0 | 17.0 | 316.4 | 1985 | 1359 | 2127 |
| WELLAND | |||||||
| 2025 | 30.5 | 10.5 | 8.2 | 230.5 | 2046 | 1435 | 2120 |
| 2024 | 29.7 | 16.6 | 8.7 | 401.6 | 2176 | 1537 | 2312 |
| 2023 | 28.0 | 12.4 | 14.6 | 393.3 | 1980 | 1353 | 2028 |
| 10 YR Norm (2011-2020) | 27.5 | 14.4 | 12.7 | 333.6 | 1999 | 1369 | 2171 |
| GODERICH | |||||||
| 2025 | 29.9 | 8.0 | 0.0 | 227.9 | 1873 | 1272 | 1932 |
| 2024 | 28.1 | 13.3 | 19.4 | 285.9 | 1971 | 1342 | 2057 |
| 2023 | 26.6 | 10.3 | 30.5 | 276.2 | 1819 | 1216 | 1850 |
| 10 YR Norm (2011-2020) | 25.3 | 14.3 | 23.1 | 311.5 | 1804 | 1184 | 1954 |
| ELORA | |||||||
| 2025 | 27.7 | 8.9 | 0.7 | 320.1 | 1842 | 1251 | 1899 |
| 2024 | 29.7 | 12.9 | 5.6 | 364.2 | 1966 | 1340 | 2075 |
| 2023 | 27.3 | 8.3 | 26.2 | 361.1 | 1808 | 1204 | 1839 |
| 10 YR Norm (2011-2020) | 26.8 | 11.8 | 17.6 | 353.1 | 1793 | 1178 | 1928 |
| MOUNT FOREST | |||||||
| 2025 | 27.9 | 8.0 | 0.0 | 280.2 | 1837 | 1249 | 1893 |
| 2024 | 29.6 | 12.4 | 5.8 | 345.9 | 1948 | 1325 | 2057 |
| 2023 | 26.3 | 8.0 | 11.6 | 337.2 | 1807 | 1208 | 1847 |
| 10 YR Norm (2011-2020) | 26.4 | 12.6 | 28.6 | 367.4 | 1774 | 1166 | 1928 |
| BARRIE | |||||||
| 2025 | 29.0 | 9.3 | 0.0 | 233.0 | 1844 | 1253 | 1910 |
| 2024 | 29.8 | 11.1 | 8.7 | 510.1 | 1916 | 1293 | 2036 |
| 2023 | 28.2 | 9.3 | 23.7 | 413.7 | 1794 | 1189 | 1831 |
| 10 YR Norm (2011-2020) | 26.6 | 12.6 | 22.0 | 323.0 | 1757 | 1152 | 1903 |
| PETERBOROUGH | |||||||
| 2025 | 30.4 | 6.3 | 0.0 | 247.7 | 1887 | 1286 | 1925 |
| 2024 | 30.8 | 9.8 | 18.5 | 371.4 | 1965 | 1337 | 2049 |
| 2023 | 27.4 | 8.7 | 27.5 | 371.9 | 1836 | 1220 | 1825 |
| 10 YR Norm (2011-2020) | 27.6 | 11.6 | 25.3 | 322.3 | 1821 | 1205 | 1933 |
| KEMPTVILLE | |||||||
| 2025 | 29.1 | 8.3 | 0.0 | 245.8 | 1965 | 1361 | 2030 |
| 2024 | 31.7 | 11.4 | 29.5 | 412.5 | 2069 | 1441 | 2198 |
| 2023 | 26.5 | 7.9 | 5.1 | 376.1 | 1961 | 1350 | 1981 |
| 10 YR Norm (2011-2020) | 28.2 | 13.6 | 12.1 | 339.4 | 1912 | 1297 | 2059 |
| SUDBURY | |||||||
| 2025 | 27.1 | 7.4 | 0.0 | 306.3 | 1617 | 1059 | 1719 |
| 2024 | 31.3 | 10.8 | 2.1 | 422.0 | 1790 | 1192 | 1918 |
| 2023 | 25.2 | 6.7 | 3.9 | 441.4 | 1695 | 1132 | 1765 |
| 10 YR Norm (2011-2020) | 26.7 | 12.8 | 20.0 | 330.4 | 1648 | 1093 | 1828 |
| EARLTON | |||||||
| 2025 | 27.4 | 6.6 | 0.4 | 325.9 | 1564 | 1022 | 1671 |
| 2024 | 33.1 | 9.2 | 4.6 | 363.5 | 1761 | 1169 | 1872 |
| 2023 | 26.0 | 6.5 | 7.6 | 273.9 | 1667 | 1103 | 1730 |
| 10 YR Norm (2011-2020) | 25.7 | 10.7 | 21.6 | 302.5 | 1537 | 1006 | 1708 |
| SAULT STE MARIE | |||||||
| 2025 | 28.9 | 9.4 | 0.0 | 265.9 | 1573 | 1006 | 1618 |
| 2024 | 30.2 | 9.6 | 2.2 | 392.9 | 1653 | 1040 | 1703 |
| 2023 | 26.6 | 9.2 | 0.6 | 286.5 | 1634 | 1068 | 1670 |
| 10 YR Norm (2011-2020) | 26.1 | 9.5 | 12.4 | 334.3 | 1475 | 921 | 1572 |
| THUNDER BAY | |||||||
| 2025 | 27.4 | 8.6 | 0.0 | 336.8 | 1471 | 933 | 1591 |
| 2024 | 31.8 | 7.5 | 0.0 | 278.1 | 1556 | 967 | 1583 |
| 2023 | 30.9 | 10.0 | 0.3 | 211.8 | 1518 | 976 | 1607 |
| 10 YR Norm (2011-2020) | 27.1 | 10.2 | 10.5 | 320.5 | 1450 | 907 | 1564 |
| FORT FRANCES | |||||||
| 2025 | 25.9 | 4.6 | 4.1 | 320.8 | 1651 | 1078 | 1758 |
| 2024 | 30.1 | 4.6 | 10.9 | 369.9 | 1617 | 1017 | 1677 |
| 2023 | 30.7 | 8.0 | 1.6 | 255.2 | 1684 | 1135 | 1809 |
| 10 YR Norm (2011-2020) | 27.1 | 9.1 | 13.6 | 323.0 | 1575 | 1014 | 1717 |
This weather summary is compiled by OMAFA using Environment Canada weather station data provided by Agriculture and Agri-Food Canada. Data quality is verified but accuracy is not guaranteed and should be used for general information purposes only. For additional locations and weather analysis, visit the OMAFA Pest and Weather System (PAWS)
One thought on “Crop Report – August 07, 2025 ”
Comments are closed.