Pre-harvest Management of Soybeans
Many soybean fields are now beginning to yellow, which indicates they are at the R6 (full seed) growth stage. This means that green soybean seeds fill the pod cavity on one of the 4 top nodes. At this stage, pods have reached their full length and no new pods form. Root growth slows substantially as the plant shifts nutrients to the seed. Once soybeans reach the R6 growth stage, crop protection products are no longer recommended as they cannot improve yield potential. Seed number and size are set, and the seed is now drying down. Although spider mites are widespread this year, control at this stage is no longer warranted.
Maintaining Seed Quality at Harvest
If the soybeans are identity-preserved (IP), take extra time to maintain seed quality. Staining and mechanical damage are the main problems at harvest that can downgrade quality. An entire load may be rejected due to mechanical damage. Staining can occur from weeds, immature beans, dirt, and dust. To avoid contamination, make sure that combines, trucks, wagons, and bins are clean before harvest. Scout and rogue fields for off-types and other volunteer crops. Inspect fencerows and roadsides for glass, metal, and other debris. To prevent green staining, the IP soybean harvest must wait until all weeds and soybean stems have dried down. Remove weeds such as Eastern black nightshade and American pokeweed from the field before harvest.
Pre-harvest herbicide timing
A pre-harvest herbicide treatment can make harvest more efficient when there is an unacceptable number of weeds in the crop. Both conventional and glyphosate-tolerant fields that are weedy can benefit from a pre-harvest herbicide. Drier plant matter will pass more easily through the combine, lowering seed losses and reducing seed staining. Pre-harvest herbicides do not speed up how fast soybeans mature, nor make soybean seed dry down faster. However, they will speed up harvest timing by 1-3 days because remaining leaves will drop more quickly, and green material will dry up. Green tissue will be killed, such as leaves, stems, or pods, but green seed does not dry down more quickly. Crop quality often increases because the harvest timing after the field has been sprayed is more predictable. Most importantly, a pre-harvest burndown will dry down weeds, making harvest easier and clean up the field for winter wheat planting.
Application timing is critical. Do not spray too early. If the application occurs early, yield losses can occur, and chemical residues will be taken into the seed. If large patches of soybeans in the field remain green, it will be necessary to wait for those areas to mature before spraying. It is safe to spray when the seed fill is complete. This can be determined by a colour change of the seed from green to yellow. A change in colour of the pods is an excellent indicator that the seed has also changed colour. Since the colour change of the pods is gradual, it may be difficult to determine when the pods have truly “changed” from green to yellow or brown. A change in colour is defined by the absence of any green colour left on the pod. At least 90% of the pods need to have changed colour and no longer contain any green. This stage of the crop typically occurs when there is at least 80% leaf drop, although a field should not be assessed by leaf drop alone. Pod colour change is the best indicator for when to spray.
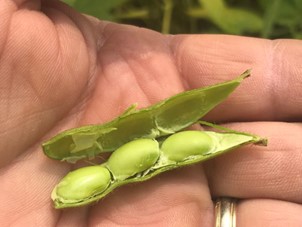
Another way to assess if the field is ready is to determine if the seed has separated from the pod. Once the seeds turn yellow, the next visual change is that the seeds start to shrink inside the pod and separate from the white membrane inside the pod. Figure 1 shows seed that has not detached from the pod and still has some green colour. This field should not be sprayed.
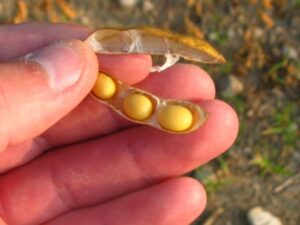
Once the seeds have detached from the pod, as in Figure 2, the seed is considered mature, and the field can now be sprayed. Collect several random pods from the top third of the plant. If all the seeds have separated from the pod, then the crop has reached physiological maturity and can be sprayed.

Typically, pods from the bottom of the plant at this stage look like they are ready to be thrashed and have started to dry down. See Figure 3.
Check the pre-harvest interval when using pre-harvest herbicides. For example, glyphosate has a 7-day pre-harvest interval. Eragon LQ has a 3-day interval, although typically the field is ready to harvest at 7 to 10 days after application because the weeds have had time to dry down. If a tank mix is applied, you must use the longest pre-harvest interval of the products used (e.g., 7 days if glyphosate and Eragon LQ are tank mixed). If you are harvesting food-grade soybeans for the export market, there may be restrictions on what pre-harvest herbicides you can use. Contact your buyer to verify what pre-harvest products are acceptable.
Salvaging soybeans as forage
In areas that were extremely dry, growers may be considering salvaging soybeans to increase forage inventories. This is not recommended. Most spray programs prevent using the crop for grazing, silage, or fodder. Check all pesticide labels for pre-harvest or pre-grazing intervals, and prohibitions against using the crop as forage. Do not graze once pod fill has begun since raw soybean seeds cause ammonia toxicity in ruminants, which can be fatal. Healthy soybean plants are difficult to ferment, and data is lacking on stressed soybeans. Soybeans do not have as much sugar or starch as conventional silage crops and buffer against a pH drop. The likelihood of soybean silage rotting rather than fermenting is high. Soybeans are not suitable for baleage.
OMAFA Weather Summary: Thurs Aug 21—Wed Aug 27, 2025
| Location | Highest Temp (°C) | Lowest Temp (°C) | Rain for Week (mm) | Rain Since April 1st (mm) | GDD0C April 1st | GDD5C April 1st | CHU May 1st |
| HARROW | |||||||
| 2025 | 25.0 | 9.1 | 0.0 | 384.9 | 2617 | 1894 | 2820 |
| 2024 | 31.9 | 8.3 | 23.5 | 418.9 | 2739 | 1992 | 2958 |
| 2023 | 28.7 | 12.3 | 119.2 | 569.8 | 2488 | 1759 | 2675 |
| 10 YR Norm (2011-2020) | 26.7 | 13.7 | 14.1 | 453.9 | 2585 | 1842 | 2895 |
| RIDGETOWN | |||||||
| 2025 | 24.9 | 5.0 | 1.7 | 320.4 | 2483 | 1763 | 2630 |
| 2024 | 31.5 | 6.2 | 4.2 | 521.7 | 2590 | 1848 | 2773 |
| 2023 | 26.9 | 9.5 | 36.2 | 495.4 | 2367 | 1647 | 2501 |
| 10 YR Norm (2011-2020) | 26.6 | 12.5 | 12.5 | 408.6 | 2433 | 1695 | 2696 |
| SARNIA | |||||||
| 2025 | 26.3 | 9.0 | 25.2 | 455.7 | 2452 | 1738 | 2572 |
| 2024 | 32.9 | 8.8 | 9.4 | 446.8 | 2593 | 1854 | 2769 |
| 2023 | 29.7 | 11.9 | 24.2 | 418.1 | 2336 | 1616 | 2442 |
| 10 YR Norm (2011-2020) | 26.9 | 14.4 | 19.0 | 420.6 | 2409 | 1674 | 2683 |
| LONDON | |||||||
| 2025 | 25.9 | 8.8 | 4.6 | 323.0 | 2402 | 1704 | 2570 |
| 2024 | 30.1 | 8.0 | 10.2 | 539.6 | 2571 | 1825 | 2770 |
| 2023 | 25.7 | 10.1 | 63.1 | 539.6 | 2346 | 1626 | 2484 |
| 10 YR Norm (2011-2020) | 26.3 | 12.7 | 19.6 | 426.8 | 2412 | 1679 | 2679 |
| BRANTFORD | |||||||
| 2025 | 27.2 | 7.4 | 1.8 | 343.9 | 2432 | 1725 | 2541 |
| 2024 | 32.3 | 8.0 | 0.0 | 452.8 | 2520 | 1779 | 2712 |
| 2023 | 25.9 | 10.4 | 23.7 | 436.9 | 2329 | 1608 | 2460 |
| 10 YR Norm (2011-2020) | 26.0 | 11.4 | 17.7 | 378.0 | 2412 | 1682 | 2650 |
| WELLAND | |||||||
| 2025 | 26.2 | 8.7 | 2.6 | 287.6 | 2488 | 1771 | 2650 |
| 2024 | 29.6 | 9.3 | 0.0 | 453.9 | 2582 | 1838 | 2803 |
| 2023 | 26.2 | 11.2 | 44.0 | 485.8 | 2370 | 1643 | 2518 |
| 10 YR Norm (2011-2020) | 26.3 | 12.3 | 12.3 | 377.8 | 2427 | 1693 | 2701 |
| GODERICH | |||||||
| 2025 | 24.2 | 6.6 | 9.9 | 269.8 | 2298 | 1593 | 2451 |
| 2024 | 29.6 | 6.4 | 6.1 | 328.1 | 2361 | 1627 | 2534 |
| 2023 | 24.0 | 8.6 | 14.7 | 335.3 | 2175 | 1472 | 2292 |
| 10 YR Norm (2011-2020) | 24.7 | 14.0 | 17.3 | 374.9 | 2211 | 1486 | 2467 |
| ELORA | |||||||
| 2025 | 25.8 | 5.9 | 6.3 | 360.1 | 2246 | 1549 | 2376 |
| 2024 | 29.5 | 7.5 | 0.0 | 407.0 | 2337 | 1605 | 2516 |
| 2023 | 24.0 | 9.1 | 38.8 | 428.8 | 2154 | 1450 | 2258 |
| 10 YR Norm (2011-2020) | 24.5 | 10.9 | 19.4 | 424.5 | 2180 | 1459 | 2399 |
| MOUNT FOREST | |||||||
| 2025 | 25.8 | 5.6 | 7.3 | 339.4 | 2250 | 1557 | 2389 |
| 2024 | 28.6 | 6.4 | 8.7 | 390.9 | 2326 | 1598 | 2513 |
| 2023 | 23.3 | 7.2 | 21.2 | 383.0 | 2151 | 1452 | 2265 |
| 10 YR Norm (2011-2020) | 24.0 | 11.9 | 18.3 | 435.4 | 2167 | 1454 | 2414 |
| BARRIE | |||||||
| 2025 | 26.9 | 7.7 | 10.8 | 295.1 | 2260 | 1564 | 2397 |
| 2024 | 30.7 | 8.7 | 2.4 | 519.1 | 2294 | 1566 | 2485 |
| 2023 | 23.2 | 8.7 | 1.6 | 485.3 | 2150 | 1445 | 2269 |
| 10 YR Norm (2011-2020) | 24.6 | 11.0 | 15.8 | 381.8 | 2146 | 1436 | 2378 |
| PETERBOROUGH | |||||||
| 2025 | 26.0 | 6.4 | 4.5 | 309.2 | 2295 | 1589 | 2394 |
| 2024 | 28.9 | 7.6 | 0.0 | 392.4 | 2341 | 1608 | 2490 |
| 2023 | 24.9 | 7.7 | 2.1 | 409.6 | 2206 | 1490 | 2279 |
| 10 YR Norm (2011-2020) | 25.5 | 10.1 | 19.8 | 377.5 | 2214 | 1493 | 2404 |
| KEMPTVILLE | |||||||
| 2025 | 29.7 | 7.6 | 1.5 | 265.0 | 2400 | 1691 | 2526 |
| 2024 | 28.6 | 10.8 | 8.8 | 518.1 | 2479 | 1746 | 2695 |
| 2023 | 26.0 | 10.1 | 2.2 | 480.7 | 2342 | 1630 | 2452 |
| 10 YR Norm (2011-2020) | 26.2 | 12.0 | 29.3 | 423.0 | 2329 | 1609 | 2570 |
| SUDBURY | |||||||
| 2025 | 26.6 | 5.0 | 27.8 | 351.2 | 2015 | 1351 | 2187 |
| 2024 | 29.5 | 7.2 | 14.1 | 477.2 | 2172 | 1469 | 2369 |
| 2023 | 23.8 | 7.3 | 4.5 | 477.3 | 2029 | 1366 | 2165 |
| 10 YR Norm (2011-2020) | 23.6 | 11.0 | 18.9 | 399.9 | 2028 | 1369 | 2297 |
| EARLTON | |||||||
| 2025 | 27.5 | 6.3 | 26.3 | 369.6 | 1953 | 1306 | 2122 |
| 2024 | 31.5 | 5.2 | 60.7 | 432.5 | 2134 | 1437 | 2296 |
| 2023 | 24.5 | 4.9 | 1.5 | 311.3 | 1997 | 1333 | 2117 |
| 10 YR Norm (2011-2020) | 23.3 | 10.5 | 16.8 | 361.8 | 1896 | 1259 | 2139 |
| SAULT STE MARIE | |||||||
| 2025 | 25.6 | 5.6 | 17.6 | 384.3 | 1978 | 1306 | 2114 |
| 2024 | 27.6 | 7.7 | 42.2 | 487.3 | 2026 | 1308 | 2155 |
| 2023 | 24.7 | 5.9 | 35.1 | 361.4 | 1975 | 1309 | 2082 |
| 10 YR Norm (2011-2020) | 23.9 | 10.9 | 21.4 | 402.3 | 1847 | 1188 | 2022 |
| THUNDER BAY | |||||||
| 2025 | 27.0 | 4.0 | 25.9 | 371.0 | 1847 | 1204 | 2037 |
| 2024 | 30.8 | 5.8 | 17.4 | 320.9 | 1941 | 1247 | 2040 |
| 2023 | 25.0 | 3.4 | 24.2 | 265.6 | 1849 | 1206 | 1991 |
| 10 YR Norm (2011-2020) | 24.1 | 9.0 | 11.8 | 366.5 | 1813 | 1165 | 1995 |
| FORT FRANCES | |||||||
| 2025 | 25.8 | 2.3 | 16.0 | 363.1 | 2019 | 1340 | 2193 |
| 2024 | 30.4 | 12.1 | 1.9 | 381.9 | 2002 | 1297 | 2134 |
| 2023 | 26.3 | 5.7 | 15.3 | 307.0 | 2014 | 1365 | 2194 |
| 10 YR Norm (2011-2020) | 25.1 | 8.1 | 14.3 | 372.2 | 1935 | 1269 | 2142 |
This weather summary is compiled by OMAFA using Environment Canada weather station data provided by Agriculture and Agri-Food Canada. Data quality is verified but accuracy is not guaranteed and should be used for general information purposes only. For additional locations and weather analysis, visit the OMAFA Pest and Weather System (PAWS)