
Crop Conditions – Week of September 1st, 2025.
As the 2025 corn season nears its end, two significant diseases—tar spot and southern rust have been getting considerable attention from agronomists and growers across Ontario and the US Corn Belt. Tar spot has been confirmed from Ontario to Kansas, while southern rust’s fast-moving progression from the southern US to Ontario has been alarming! These diseases are great examples of how environmental conditions impact pathogen biology and disease progression rates.
Tar Spot
The initial 2025 tar spot detections for Ontario, starting in early to mid-July, were like previous years. Tar spot has become firmly established in Ontario corn fields, notably in southwest areas and along the north shore of Lake Erie, stretching from Essex to Niagara, and increasingly in south-central zones north of London up toward Toronto.
The extended high temperatures, as well as the drier conditions, have been very different from the previous four years we have had tar spot in Ontario. Although spring conditions were not that much different than previous years, tar spot was found at very low levels in West Elgin in early July, just like the other four years. This season has trended similarly to 2022 when it comes to tar spot with hotter and drier conditions, which significantly reduced tar spot disease development then previous years. With low tar spot in the US Midwest corn belt, this has reduced spore movement into the province. In August, more favourable environmental conditions have seen tar spot development in traditional areas in southwestern Ontario. This late-season resurgence, as well as fungicide applications, will reduce yield loss expectations compared to the previous two years.
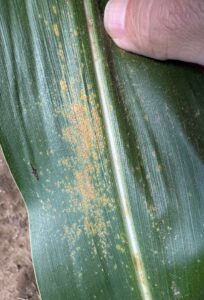
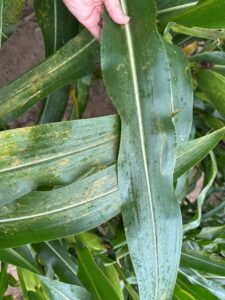
Southern Rust
Southern Rust has emerged as a major foliar disease threat across the U.S. during the 2025 growing season, particularly in the Midwest. The Persistent warm (around 80°F / 27°C), humid, and wet conditions from mid- to late summer, which were unfavourable for tar spot created ideal conditions for southern rust development and spread. The disease has become the number one disease of concern this year in the Midwest. Southern rust is not new to Ontario, but it is found every year, especially in the extreme southwest in Essex and Chatham-Kent counties. With the higher disease pressure in the US, southern rust infections are higher this year in the southwest, and the impact is still being evaluated.
Ontario corn test plot observations in 2025 show reduced southern rust severity where fungicide was applied.
What about Soybeans?
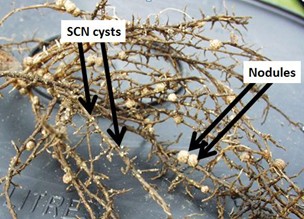
Soybean cyst nematode (SCN) and sudden death syndrome (SDS) have been two soybean diseases that have been noticeable this year. Management for both diseases begins with detection and the use of resistant varieties. Check with your seed supplier for varieties which meet your needs.
The fall is a perfect time to sample harvested soybean fields or those which will be planted to soybeans in 2026. Sampling for SCN after or at harvest provides a perfect opportunity to “take the test” since it is typically a time when soil samples are taken to determine next year’s fertilizer program. It is as simple as taking a few more soil cores from the field, mixing them together, splitting the sample and sending half for your fertilizer recommendations and the other half for a SCN analysis. Fall sampling also helps identify poor-yielding fields or areas within the field that need sampling while they are fresh in your mind. A fall sample takes into account any significant SCN population changes that have occurred during the growing season.
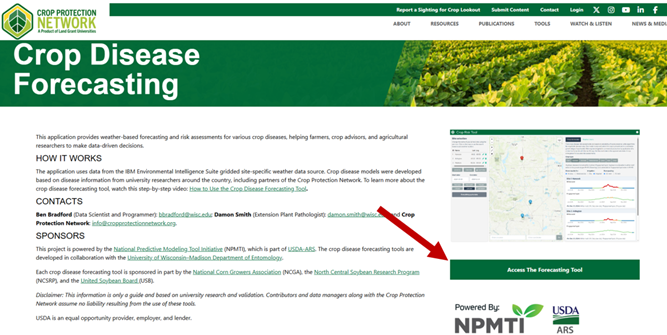
New Crop Protection Network (CPN) Forecasting Tool adds DON risk assessment!
The Crop Protection Network has launched the Crop Disease Forecasting Tool, a free, web-based resource designed to help users assess the risk of major foliar diseases in corn and soybeans. This tool replaces older apps like Tarspotter and Sporecaster, which are no longer supported. Built on years of university-led field research and modelling, the tool provides daily updates and a 7-day forecast using local weather data. It currently includes models for tar spot and gray leaf spot in corn, and white mold and frogeye leaf spot in soybeans- helping users make timely, field-specific fungicide decisions. Try the tool today: Crop Disease Forecasting Tool.
In addition to foliar disease forecasting, the tool now supports mycotoxin risk assessment. Gibberella ear rot is caused by the fungus Gibberella zeae (synonym Fusarium graminearum). It is a consistently important mycotoxigenic fungus in the northern Corn Belt, producing deoxynivalenol (DON or vomitoxin), zearalenone, and other toxins. Corn is susceptible to Gibberella ear rot during silking. The DON model on the CPN Forecasting website is based on equations which calculate the probability of DON above 1 ppm at harvest. Risk scores are assigned based on probabilities formulated in the model using weather parameters around the corn silking growth stage.
OMAFA Weather Summary: Thurs Aug 28—Wed Sept 3 2025
| Location | Highest Temp (°C) | Lowest Temp (°C) | Rain for Week (mm) | Rain Since April 1st (mm) | GDD0C April 1st | GDD5C April 1st | CHU May 1st |
| HARROW | |||||||
| 2025 | 27.6 | 5.8 | 4.1 | 389.0 | 2732 | 1974 | 2953 |
| 2024 | 29.6 | 7.4 | 30.1 | 449.0 | 2883 | 2101 | 3136 |
| 2023 | 29.0 | 7.8 | 0.0 | 569.8 | 2612 | 1848 | 2823 |
| 10 YR Norm (2011-2020) | 27.2 | 15.6 | 21.0 | 474.9 | 2733 | 1956 | 3082 |
| RIDGETOWN | |||||||
| 2025 | 26.8 | 5.0 | 0.0 | 320.4 | 2589 | 1833 | 2748 |
| 2024 | 27.6 | 5.7 | 22.2 | 543.9 | 2724 | 1947 | 2937 |
| 2023 | 29.5 | 5.5 | 4.3 | 499.7 | 2484 | 1729 | 2635 |
| 10 YR Norm (2011-2020) | 26.9 | 13.7 | 19.1 | 427.8 | 2574 | 1802 | 2870 |
| SARNIA | |||||||
| 2025 | 27.0 | 7.4 | 20.0 | 475.7 | 2562 | 1812 | 2699 |
| 2024 | 30.8 | 7.1 | 17.4 | 464.2 | 2730 | 1956 | 2937 |
| 2023 | 29.3 | 7.5 | 4.3 | 422.4 | 2457 | 1703 | 2584 |
| 10 YR Norm (2011-2020) | 26.7 | 15.0 | 11.5 | 432.1 | 2552 | 1782 | 2862 |
| LONDON | |||||||
| 2025 | 26.7 | 5.4 | 5.0 | 328.0 | 2511 | 1777 | 2692 |
| 2024 | 28.4 | 6.3 | 5.9 | 545.5 | 2702 | 1921 | 2929 |
| 2023 | 28.1 | 7.3 | 3.7 | 543.3 | 2463 | 1708 | 2620 |
| 10 YR Norm (2011-2020) | 26.4 | 13.5 | 15.9 | 442.6 | 2552 | 1783 | 2852 |
| BRANTFORD | |||||||
| 2025 | 27.8 | 4.8 | 5.3 | 349.2 | 2540 | 1798 | 2660 |
| 2024 | 28.9 | 5.5 | 5.2 | 458.0 | 2649 | 1873 | 2865 |
| 2023 | 28.3 | 6.3 | 3.9 | 440.8 | 2444 | 1688 | 2592 |
| 10 YR Norm (2011-2020) | 26.9 | 11.4 | 9.3 | 387.3 | 2549 | 1784 | 2816 |
| WELLAND | |||||||
| 2025 | 26.4 | 6.0 | 11.0 | 298.6 | 2599 | 1847 | 2776 |
| 2024 | 28.6 | 6.1 | 5.1 | 459.0 | 2714 | 1934 | 2961 |
| 2023 | 26.5 | 8.3 | 2.7 | 488.5 | 2493 | 1731 | 2666 |
| 10 YR Norm (2011-2020) | 26.4 | 12.9 | 12.8 | 390.6 | 2568 | 1798 | 2875 |
| GODERICH | |||||||
| 2025 | 26.2 | 5.6 | 18.1 | 287.9 | 2403 | 1662 | 2568 |
| 2024 | 29.1 | 5.3 | 2.5 | 330.6 | 2491 | 1722 | 2694 |
| 2023 | 26.0 | 5.9 | 22.0 | 357.3 | 2286 | 1548 | 2420 |
| 10 YR Norm (2011-2020) | 24.6 | 13.7 | 9.4 | 384.3 | 2344 | 1584 | 2634 |
| ELORA | |||||||
| 2025 | 24.8 | 3.7 | 16.9 | 377.0 | 2345 | 1613 | 2485 |
| 2024 | 27.3 | 4.8 | 16.5 | 423.5 | 2453 | 1687 | 2653 |
| 2023 | 27.5 | 5.6 | 7.4 | 436.2 | 2263 | 1524 | 2382 |
| 10 YR Norm (2011-2020) | 25.3 | 11.5 | 11.0 | 435.5 | 2308 | 1552 | 2555 |
| MOUNT FOREST | |||||||
| 2025 | 24.5 | 4.8 | 11.9 | 351.3 | 2351 | 1622 | 2499 |
| 2024 | 27.0 | 5.1 | 4.1 | 395.0 | 2444 | 1682 | 2656 |
| 2023 | 26.8 | 5.2 | 9.0 | 392.0 | 2261 | 1527 | 2391 |
| 10 YR Norm (2011-2020) | 24.5 | 12.2 | 13.0 | 448.4 | 2295 | 1547 | 2572 |
| BARRIE | |||||||
| 2025 | 25.1 | 3.7 | 5.0 | 300.1 | 2361 | 1630 | 2509 |
| 2024 | 26.3 | 7.1 | 15.7 | 534.8 | 2413 | 1649 | 2627 |
| 2023 | 28.7 | 5.7 | 10.1 | 495.4 | 2261 | 1521 | 2397 |
| 10 YR Norm (2011-2020) | 24.6 | 11.0 | 11.2 | 393.0 | 2270 | 1526 | 2530 |
| PETERBOROUGH | |||||||
| 2025 | 25.2 | 4.5 | 5.6 | 314.8 | 2397 | 1656 | 2504 |
| 2024 | 26.5 | 4.6 | 17.2 | 409.6 | 2455 | 1687 | 2621 |
| 2023 | 28.9 | 4.5 | 0.4 | 410.0 | 2317 | 1566 | 2402 |
| 10 YR Norm (2011-2020) | 25.9 | 9.7 | 14.2 | 391.7 | 2341 | 1585 | 2555 |
| KEMPTVILLE | |||||||
| 2025 | 27.6 | 8.1 | 10.4 | 275.4 | 2520 | 1775 | 2664 |
| 2024 | 25.8 | 5.3 | 16.0 | 534.1 | 2595 | 1827 | 2832 |
| 2023 | 28.7 | 7.2 | 25.4 | 506.1 | 2463 | 1717 | 2595 |
| 10 YR Norm (2011-2020) | 25.0 | 12.1 | 14.4 | 437.4 | 2459 | 1704 | 2730 |
| SUDBURY | |||||||
| 2025 | 25.3 | 3.0 | 7.3 | 358.5 | 2115 | 1417 | 2296 |
| 2024 | 25.0 | 6.4 | 7.1 | 484.3 | 2279 | 1541 | 2492 |
| 2023 | 26.3 | 5.3 | 33.3 | 510.6 | 2140 | 1442 | 2291 |
| 10 YR Norm (2011-2020) | 23.5 | 10.7 | 25.8 | 425.7 | 2147 | 1453 | 2441 |
| EARLTON | |||||||
| 2025 | 26.6 | 6.4 | 4.6 | 374.2 | 2061 | 1379 | 2243 |
| 2024 | 25.8 | 4.0 | 11.5 | 444.0 | 2236 | 1504 | 2410 |
| 2023 | 29.1 | 4.2 | 26.7 | 338.0 | 2109 | 1409 | 2241 |
| 10 YR Norm (2011-2020) | 23.4 | 8.6 | 28.1 | 389.9 | 2007 | 1335 | 2270 |
| SAULT STE MARIE | |||||||
| 2025 | 26.0 | 5.0 | 18.3 | 402.6 | 2081 | 1374 | 2227 |
| 2024 | 22.8 | 6.9 | 19.6 | 506.9 | 2133 | 1380 | 2281 |
| 2023 | 27.9 | 6.0 | 23.2 | 384.6 | 2090 | 1389 | 2213 |
| 10 YR Norm (2011-2020) | 23.2 | 9.8 | 22.2 | 424.5 | 1964 | 1270 | 2163 |
| THUNDER BAY | |||||||
| 2025 | 27.3 | 2.5 | 19.5 | 390.5 | 1950 | 1271 | 2148 |
| 2024 | 27.0 | 3.6 | 15.1 | 336.0 | 2047 | 1318 | 2158 |
| 2023 | 32.8 | 1.9 | 5.1 | 270.7 | 1972 | 1294 | 2128 |
| 10 YR Norm (2011-2020) | 23.5 | 8.4 | 21.2 | 387.6 | 1924 | 1241 | 2126 |
| FORT FRANCES | |||||||
| 2025 | 28.5 | 1.9 | 2.1 | 365.2 | 2134 | 1421 | 2323 |
| 2024 | 26.6 | 3.6 | 41.5 | 423.4 | 2115 | 1376 | 2266 |
| 2023 | 32.1 | 4.5 | 0.5 | 307.5 | 2142 | 1458 | 2338 |
| 10 YR Norm (2011-2020) | 24.1 | 7.9 | 18.9 | 391.1 | 2048 | 1346 | 2274 |
This weather summary is compiled by OMAFA using Environment Canada weather station data provided by Agriculture and Agri-Food Canada. Data quality is verified but accuracy is not guaranteed and should be used for general information purposes only. For additional locations and weather analysis, visit the OMAFA Pest and Weather System (PAWS)
One thought on “Crop Report – September 4, 2025”
Comments are closed.