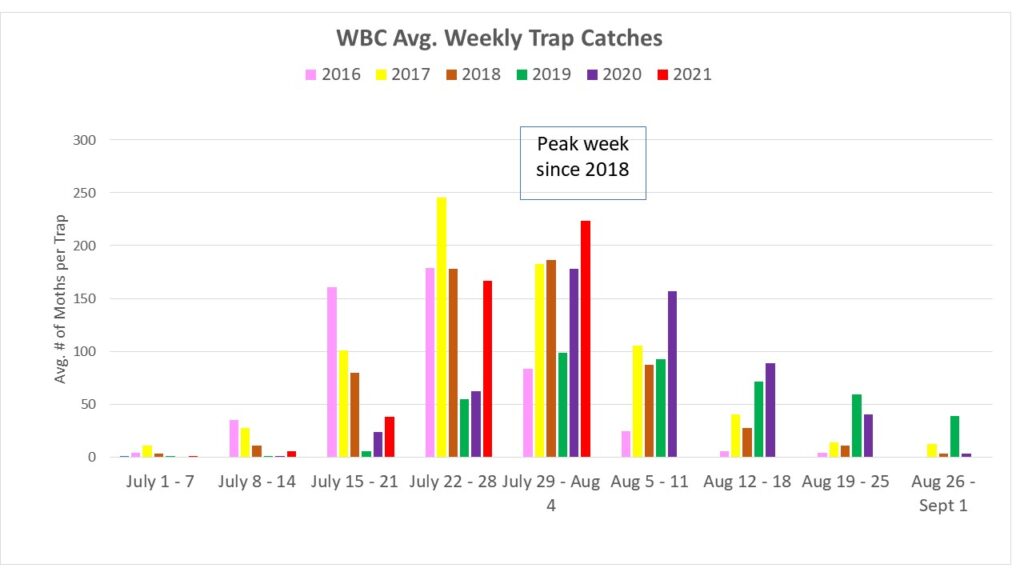
Based on WBC trap counts, peak flight likely took place over the last 7 days. Though we never know for sure until a week later when moth catches really dropped. That said, comparing this year to previous years, it lands in the same week we have experienced peak flight since 2018 (Figure 1). Peak flight means that during that period, there is the highest number of moths active in the area and that are likely laying eggs.
Looking at trap catches by county, many significantly increased last week while some are dropping in counts already. Light blue down arrows indicate those counties that declined in moth catches, while purple up arrows indicate those counties that increased from the previous week (Figure 2). Traps in central Ontario saw a slight drop which is surprising as we normally expect central and eastern Ontario to peak one week later than the rest of the provinces.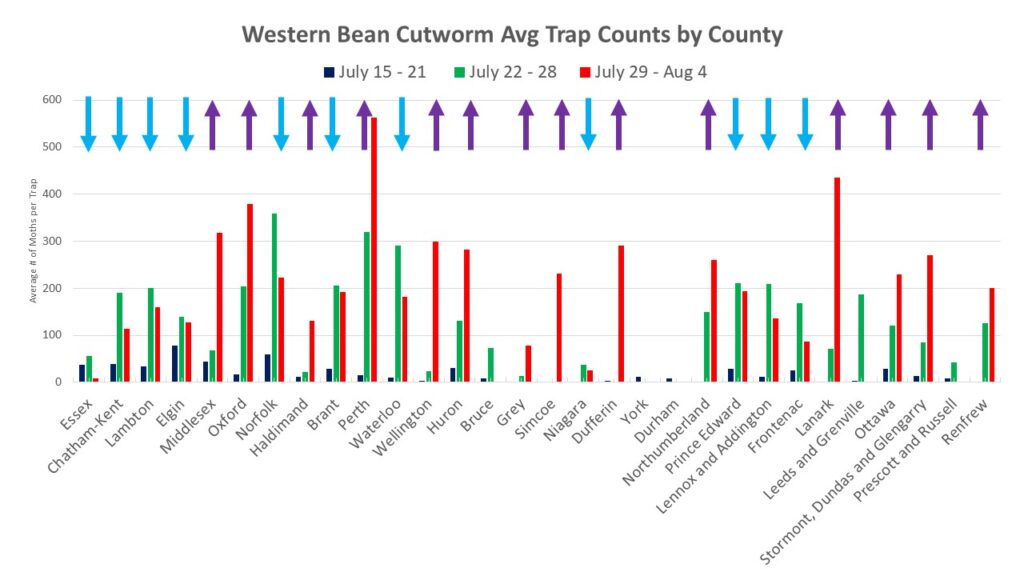
Figure 2. WBC Trap Counts by County. Blue down arrows indicate counts decreased from previous week while counties with purple up arrows increased.Comparing traps beside corn, sweet corn and dry bean fields, WBC catches are increasing in dry bean fields while corn is starting to plateau (Figure 3). Dry bean growers with traps catching 150 or more moths should scout these fields and consider an application of insecticide in 10 to 20 days if pods are present. More info on WBC management in dry beans can be found at: https://drybeanagronomy.ca/western-bean-cutworm/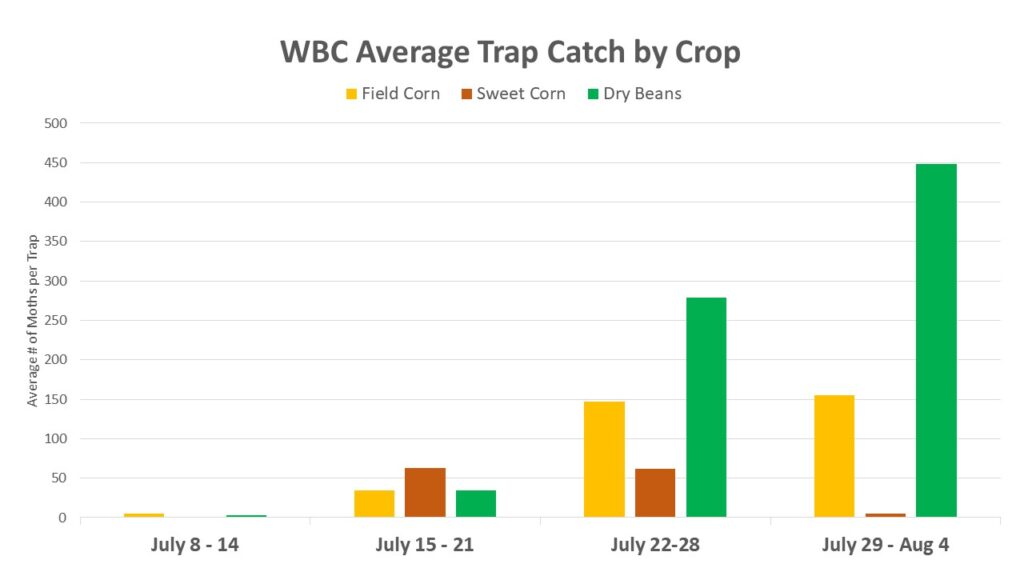
Figure 3. WBC Trap Catches by Crop.