
The 2025 AgSpray Expo; Innovations & Best Practices in Agricultural Spraying was a one-of-a-kind summer event that was not to be missed! July 23rd was a warm sunny day north of Brockville, ON, perfect for demonstrating sprayers, drones, and sensor equipment. With more than 120 people in attendance, smaller groups took in eight sessions that covered all aspects of field crop spraying.
There were education sessions on sensors and optics, drift mitigation, handling and loading, and drone applications, and participating dealers from across the province demonstrated state-of-the-art machines from Horsch, Agrifac, John Deere and Amazone. Participants could even jump in for a ride along.
Tenders & Nurses & Closed Transfer, Oh My!
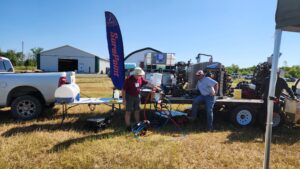
For loading sprayers safely, there was a demonstration of closed transfers where participants had the opportunity to see the QuickDraw loading system at work and have an interactive discussion on safety while loading sprayers. Closed transfers can be explained as a way of loading sprayers with a system that never puts an operator in contact with the product – the seal is broken, the jug emptied and triple rinsed all in one step. This system is aimed to reduce operator exposure to chemicals. Ed Hanson (SurePoint Ag) and Dr. Jason Deveau (Ontario Ministry Agriculture Food and Agribusiness) took operators and agronomists through the process of loading a sprayer, highlighting new technology that is being introduced to improve safety of the people handing chemical containers. Ranging from full induction systems that become part of your spray trailer, to simple chemical lids (EasyConnect System; a system that meets ISO standards) these new technologies allow the applicator to remove the jug seal and empty it without ever coming in contact with the product. There were solutions for every scale of applicator.
My Spidey Senses are Tingling!
Dr. Tom Wolf (Agrimetrix) showed attendees the intricacies of the John Deere See and Spray Ultimate, and the sensors and optics systems that it’s composed of. Tom highlighted the differences in the types of optic and sensor-based technology. For example, the green on green (optics) and the green on brown (chlorophyll) can be a key player in the management of weed resistance. The technology allows for targeted, cost-effective, residual herbicide applications in row crop fields. He also emphasized how this technology is most effective with level booms, and still requires effective whole field management in the fall to compliment spot-spraying in season.
Droning On and On
Dr. Michael Reinke (Michigan State University Extension) and Adrian Rivard (DroneSpray Canada) had the most distracting session of the day, as they focused on the implementation of drone usage in Ontario, and how they may be effectively used going forward (Note; the use of drones for herbicide/insecticide/fungicide applications is not yet approved in Ontario). Much of their presentation time was spent explaining the variables in drones; sizes of holding tanks, battery life, and different types of Rotary Atomizers. Then, they flew a blue dye demonstration, showing the limitations of coverage, how the downforce of the drone changes the application pattern (compared to that of a ground rig or helicopter application) and showed how wide of a swath could be properly applied.
Don’t Catch My Drift!
Mark Ledebhur (Application Insight LLC) blew us away with his drift demonstrations in the final education session of the day. Focusing on droplet size, nozzle choices and boom heights, Mark had visuals showing us the means and medians of droplet sizes and how they change when a variable changes. Then, using a sprayer, a fan, and some strategically placed water-sensitive paper, Mark showed how most spray drift comes from very fine droplets. There are far more small and fine droplets during application then there are large ones, and much of the drift we experience is from those finer droplets. For more information on drift, check out bedriftaware.ca.
Sprayer Rodeo
The remaining four sessions of the day took attendees through demonstrations of state-of-the-art sprayers. Three self-propelled machines; the HORSCH Leeb VL 6300, the Agrifac Condor V, and the John Deere See and Spray Ultimate, as well as the Amazone UX Super (the lone pull type sprayer in attendance), spent a majority of the day taking turns on an obstacle course. In the true sense of the word, the Sprayer Rodeo portion of the day took attendees (if they wished), in cab, around the track. Specifically designed to highlight various features of each of the machines, the course boasted a bump track, a hairpin turn, a straight away and a series of berms. Each of these obstacles allowed sprayers to demonstrate boom stability, walking frames, operator comfort, and overall machine capability.
Key Messages
At the end of the day, agronomists, farmers, custom operators and enthusiasts alike took home a variety of key messages. They ranged from how application timing can make or break a program, how you can mitigate drift and movement of many products in many crops, and how you don’t need a big self-propelled machine to get the job done – the new pull-type sprayers often have the same or even more features and technology as the self-propelled rigs do.
A big thank you to our speakers, sponsors, volunteers, and participants, who made it an excellent day!
OMAFA Weather Summary: Thurs Aug 7—Wed Aug 13 2025
| Location | Highest Temp (°C) | Lowest Temp (°C) | Rain for Week (mm) | Rain Since April 1st (mm) | GDD0C April 1st | GDD5C April 1st | CHU May 1st |
| HARROW | |||||||
| 2025 | 31.8 | 19.1 | 10.3 | 379.3 | 2334 | 1682 | 2470 |
| 2024 | 27.0 | 13.1 | 0.0 | 379.3 | 2453 | 1777 | 2609 |
| 2023 | 28.1 | 12.5 | 24.0 | 382.0 | 2232 | 1568 | 2355 |
| 10 YR Norm (2011-2020) | 26.9 | 15.9 | 21.8 | 410.0 | 2288 | 1616 | 2522 |
| RIDGETOWN | |||||||
| 2025 | 31.8 | 15.7 | 26.6 | 304.6 | 2222 | 1572 | 2315 |
| 2024 | 26.9 | 11.0 | 0.0 | 483.2 | 2321 | 1649 | 2449 |
| 2023 | 27.4 | 12.0 | 6.7 | 430.3 | 2120 | 1464 | 2194 |
| 10 YR Norm (2011-2020) | 26.3 | 13.7 | 19.7 | 382.0 | 2152 | 1485 | 2350 |
| SARNIA | |||||||
| 2025 | 33.1 | 17.8 | 21.6 | 415.2 | 2179 | 1534 | 2236 |
| 2024 | 26.2 | 12.6 | 0.3 | 409.8 | 2311 | 1642 | 2429 |
| 2023 | 28.1 | 13.9 | 10.4 | 339.8 | 2089 | 1434 | 2133 |
| 10 YR Norm (2011-2020) | 27.1 | 15.3 | 20.7 | 377.1 | 2119 | 1454 | 2320 |
| LONDON | |||||||
| 2025 | 32.0 | 16.5 | 6.9 | 305.1 | 2132 | 1504 | 2244 |
| 2024 | 26.6 | 12.2 | 1.6 | 502.8 | 2301 | 1625 | 2443 |
| 2023 | 26.9 | 12.6 | 25.1 | 450.1 | 2108 | 1453 | 2190 |
| 10 YR Norm (2011-2020) | 26.7 | 14.2 | 29.5 | 384.9 | 2133 | 1469 | 2333 |
| BRANTFORD | |||||||
| 2025 | 33.6 | 15.4 | 7.4 | 334.0 | 2165 | 1528 | 2224 |
| 2024 | 27.4 | 11.6 | 6.5 | 437.6 | 2249 | 1578 | 2390 |
| 2023 | 27.5 | 11.9 | 13.1 | 372.5 | 2094 | 1438 | 2171 |
| 10 YR Norm (2011-2020) | 27.9 | 13.8 | 25.5 | 341.9 | 2132 | 1471 | 2306 |
| WELLAND | |||||||
| 2025 | 32.6 | 17.7 | 15.1 | 245.6 | 2219 | 1572 | 2325 |
| 2024 | 27.8 | 12.7 | 3.6 | 405.2 | 2314 | 1639 | 2480 |
| 2023 | 26.3 | 13.8 | 14.3 | 407.6 | 2124 | 1462 | 2209 |
| 10 YR Norm (2011-2020) | 27.1 | 14.4 | 17.7 | 351.3 | 2144 | 1479 | 2351 |
| GODERICH | |||||||
| 2025 | 32.6 | 14.6 | 6.5 | 234.4 | 2045 | 1410 | 2143 |
| 2024 | 25.9 | 10.8 | 5.6 | 291.5 | 2101 | 1437 | 2219 |
| 2023 | 25.6 | 13.2 | 10.4 | 286.6 | 1950 | 1312 | 2015 |
| 10 YR Norm (2011-2020) | 24.5 | 13.3 | 22.5 | 334.0 | 1940 | 1285 | 2126 |
| ELORA | |||||||
| 2025 | 31.3 | 14.0 | 3.1 | 323.2 | 2000 | 1374 | 2086 |
| 2024 | 25.9 | 10.7 | 6.0 | 370.2 | 2088 | 1426 | 2223 |
| 2023 | 25.9 | 10.5 | 8.3 | 369.4 | 1936 | 1297 | 1996 |
| 10 YR Norm (2011-2020) | 25.2 | 11.9 | 27.6 | 380.7 | 1924 | 1274 | 2088 |
| MOUNT FOREST | |||||||
| 2025 | 31.3 | 14.4 | 13.2 | 293.4 | 2005 | 1381 | 2097 |
| 2024 | 24.7 | 11.3 | 4.6 | 350.5 | 2072 | 1414 | 2209 |
| 2023 | 26.1 | 12.2 | 12.5 | 349.7 | 1935 | 1301 | 2006 |
| 10 YR Norm (2011-2020) | 24.9 | 12.5 | 27.4 | 394.8 | 1907 | 1264 | 2092 |
| BARRIE | |||||||
| 2025 | 32.9 | 14.1 | 11.7 | 244.7 | 2010 | 1383 | 2100 |
| 2024 | 26.4 | 10.4 | 2.9 | 513.0 | 2039 | 1381 | 2185 |
| 2023 | 26.1 | 11.3 | 52.2 | 465.9 | 1922 | 1282 | 1990 |
| 10 YR Norm (2011-2020) | 25.4 | 12.5 | 20.2 | 343.2 | 1889 | 1249 | 2065 |
| PETERBOROUGH | |||||||
| 2025 | 33.4 | 12.2 | 8.8 | 256.5 | 2048 | 1411 | 2104 |
| 2024 | 26.0 | 7.5 | 11.0 | 382.4 | 2085 | 1422 | 2191 |
| 2023 | 26.7 | 12.3 | 29.3 | 401.2 | 1971 | 1320 | 1992 |
| 10 YR Norm (2011-2020) | 27.1 | 12.0 | 23.6 | 345.8 | 1956 | 1305 | 2096 |
| KEMPTVILLE | |||||||
| 2025 | 35.5 | 12.8 | 15.1 | 260.9 | 2141 | 1502 | 2224 |
| 2024 | 27.0 | 10.4 | 48.2 | 460.7 | 2200 | 1537 | 2360 |
| 2023 | 28.3 | 12.7 | 95.0 | 471.1 | 2099 | 1452 | 2153 |
| 10 YR Norm (2011-2020) | 27.6 | 13.5 | 29.3 | 368.7 | 2055 | 1405 | 2234 |
| SUDBURY | |||||||
| 2025 | 31.7 | 15.6 | 0.9 | 307.2 | 1782 | 1189 | 1920 |
| 2024 | 27.2 | 8.8 | 17.1 | 439.1 | 1916 | 1283 | 2070 |
| 2023 | 26.0 | 9.9 | 17.0 | 458.4 | 1815 | 1217 | 1911 |
| 10 YR Norm (2011-2020) | 25.1 | 12.4 | 27.4 | 357.8 | 1779 | 1190 | 1991 |
| EARLTON | |||||||
| 2025 | 32.0 | 12.1 | 17.4 | 343.3 | 1726 | 1149 | 1864 |
| 2024 | 29.0 | 5.2 | 4.9 | 368.4 | 1881 | 1255 | 2011 |
| 2023 | 26.6 | 10.7 | 24.1 | 298.0 | 1786 | 1187 | 1871 |
| 10 YR Norm (2011-2020) | 24.3 | 10.1 | 26.8 | 329.3 | 1658 | 1092 | 1854 |
| SAULT STE MARIE | |||||||
| 2025 | 30.2 | 12.7 | 46.7 | 312.6 | 1733 | 1131 | 1817 |
| 2024 | 26.1 | 10.0 | 38.1 | 431.0 | 1774 | 1126 | 1851 |
| 2023 | 25.2 | 11.0 | 7.5 | 294.0 | 1756 | 1155 | 1819 |
| 10 YR Norm (2011-2020) | 25.0 | 10.1 | 18.9 | 353.2 | 1600 | 1012 | 1724 |
| THUNDER BAY | |||||||
| 2025 | 29.8 | 12.3 | 6.6 | 343.4 | 1617 | 1044 | 1769 |
| 2024 | 29.6 | 9.3 | 6.3 | 284.4 | 1679 | 1055 | 1725 |
| 2023 | 29.3 | 6.0 | 22.4 | 234.2 | 1634 | 1057 | 1740 |
| 10 YR Norm (2011-2020) | 26.1 | 9.5 | 15.5 | 336.0 | 1573 | 995 | 1709 |
| FORT FRANCES | |||||||
| 2025 | 31.5 | 8.2 | 13.7 | 334.5 | 1790 | 1182 | 1925 |
| 2024 | 27.5 | 8.7 | 3.8 | 373.7 | 1729 | 1095 | 1804 |
| 2023 | 26.2 | 4.9 | 34.9 | 290.1 | 1794 | 1210 | 1937 |
| 10 YR Norm (2011-2020) | 25.5 | 8.5 | 13.8 | 336.8 | 1697 | 1100 | 1860 |
This weather summary is compiled by OMAFA using Environment Canada weather station data provided by Agriculture and Agri-Food Canada. Data quality is verified but accuracy is not guaranteed and should be used for general information purposes only. For additional locations and weather analysis, visit the OMAFA Pest and Weather System (PAWS)