Optimizing Crop Residue Management for Overall Profitability
When and where should crop residue management start? It’s an ongoing and system-wide aspect of overall crop management, so choices such as crop rotation, fertilization and tillage feed into it. However, crop residue management generally starts with the combine.
Combining crops without the proper equipment or setup can result in suboptimal grain separation. Additionally, adjustments to the threshing and chopping equipment can be made to overcome uneven residue sizing and distribution behind the combine, and should be made accordingly.
Soybean Harvest
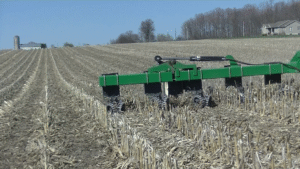
Poorly sized and distributed residue left behind the combine often pushes farmers to more tillage than may be required, like planting wheat shortly after harvesting soybeans or edible beans (Figure 1).
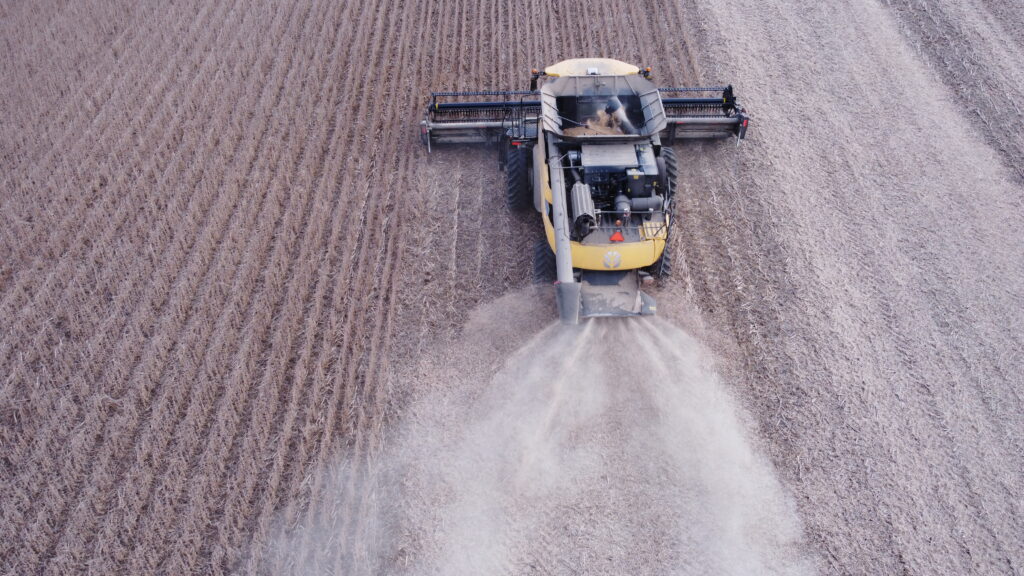
Figure 1. Ensure even and uniform distribution of soybean residue where the spread equals the header width.
The importance of planting date for winter wheat cannot be overstated. It is critical to maximize yield potential and profitability. Soybean straw can be very coarse and often damp. Distributing that residue uniformly across the width of the combine header gives the best opportunity for consistent planting right behind the combine. Ensuring maintenance and setup of the residue chopper and/or spreaders is key to effective residue management. Especially when planting wheat directly following soybean harvest, planting equipment must be well-maintained to effectively slice through the soybean straw.
Soybean harvest straw and wheat seeding tips:
- Ensure the header feeds the soybeans uniformly into the combine for even distribution of material in the feeder house.
- Inspect that chopper knives/blades are present, whole, sharp, and that the speed is correct.
- Ensure the spreader distributes chopped straw evenly over the full width of the header, but not into the unharvested area beside the combine, as this can cause issues feeding crop into the header. Stopping for a plugged knife or feeder house will cause gaps/heavy concentration in residue coverage.
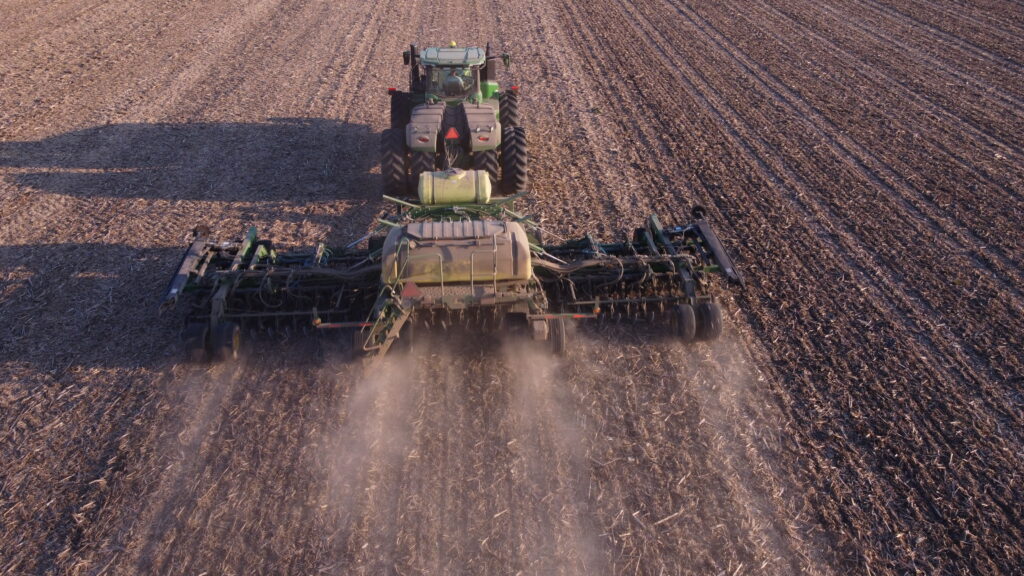
- On the drill for planting wheat, ensure the coulters and blades are sharp and of sufficient diameter to optimize cutting through the soybean stubble (Figure 2).
Corn Harvest
The big difference between combining corn and most other crops is that only the corn ears and husks go through the combine. Header maintenance and equipment must meet the farms requirements for sizing, distributing, and anchoring the residue that drops in front of the combine. The cylinder and separation equipment in the combine is more easily set for both grain separation and residue distribution since there is less material going through the combine.
Corn harvest tips:
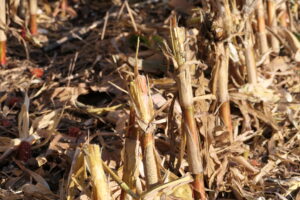
- Use header technology that meets other requirements, including cutting rolls, stalk splitters, sizing knives, etc., to manage stalks to your specifications. Options that explode the top of the corn stalk may speed up decomposition and be less damaging to equipment tires. (Figure 3)
- Adjust residue choppers and spreaders to spread the husks and cobs evenly across the width of the header.
- Determine the size of residue by considering options of finely chopped, loose ground cover, standing stalks, or large broken stalks. Smaller residues have the potential to move with surface water or wind, but standing stalks may still be standing in the spring at planting, requiring some additional management. There are varied opinions on whether the best practice is to have residue standing or covering the soil surface.
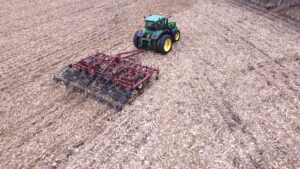
- Some farmers want finer residue sizing, but they want to secure the residue to the soil with a light vertical tillage pass shortly after harvest (Figure 4).
Regardless of the crop being harvested, it’s important to monitor how the residue is leaving the combine. Optimizing residue sizing, distribution, and uniformity leads to less need for expensive residue tillage prior to seeding the next crop.
Planting the Next Crop
Farmers’ concerns about crop residues on the surface are mostly an issue of seeding the next crop. The default is often tillage, but there may be other options. Thinking about planting soybeans into heavy corn stubble, maybe there are alternatives to tillage. Some are simply pushing the corn stubble out of the way just ahead of planting and seeding into the cleared area between the previous corn crop’s stubble (Figure 5). Or maybe it’s a light Vertical Till pass ahead of corn planting to slice the residue to prevent hair-pinning and to stimulate drying and warming of the soil.
Well-maintained planting equipment with the right accessories and updates to the coulters and blades is critical for optimizing overall residue and crop management. Depending on the equipment, choosing the right row cleaners, down-pressure system, openers, and closing system for optimal seed placement is important for optimal residue management.
Remember that residue management is not one-and-done, but an integral part of overall crop management. Consider the cost and consequences of immediately choosing aggressive fall tillage without a strategy to feed the soil life and reduce soil erosion.
OMAFA Weather Summary: Thurs Sept 18—Wed Sept 24, 2025
| Location | Highest Temp (°C) | Lowest Temp (°C) | Rain for Week (mm) | Rain Since April 1st (mm) | GDD0C April 1st | GDD5C April 1st | CHU May 1st |
| HARROW | |||||||
| 2025 | 28.9 | 11.2 | 129.3 | 530.0 | 3109 | 2246 | 3402 |
| 2024 | 28.7 | 14.1 | 7.9 | 460.4 | 3284 | 2398 | 3622 |
| 2023 | 25.9 | 7.8 | 0.0 | 586.7 | 2987 | 2118 | 3277 |
| 10 YR Norm (2011-2020) | 23.9 | 9.9 | 21.1 | 528.6 | 3110 | 2227 | 3546 |
| RIDGETOWN | |||||||
| 2025 | 30.5 | 9.8 | 25.1 | 355.5 | 2956 | 2096 | 3182 |
| 2024 | 29.1 | 11.7 | 19.1 | 570.7 | 3115 | 2232 | 3407 |
| 2023 | 26.4 | 6.3 | 0.0 | 512.8 | 2850 | 1990 | 3072 |
| 10 YR Norm (2011-2020) | 23.9 | 8.3 | 19.9 | 479.9 | 2933 | 2055 | 3302 |
| SARNIA | |||||||
| 2025 | 26.4 | 10.5 | 7.6 | 492.6 | 2914 | 2059 | 3115 |
| 2024 | 28.7 | 11.5 | 15.9 | 482.0 | 3125 | 2246 | 3404 |
| 2023 | 26.7 | 8.3 | 7.4 | 488.2 | 2825 | 1965 | 3024 |
| 10 YR Norm (2011-2020) | 24.3 | 9.2 | 13.2 | 477.9 | 2916 | 2040 | 3304 |
| LONDON | |||||||
| 2025 | 30.0 | 9.9 | 24.9 | 363.0 | 2869 | 2035 | 3126 |
| 2024 | 28.7 | 12.5 | 30.3 | 585.2 | 3091 | 2206 | 3395 |
| 2023 | 24.8 | 6.3 | 1.6 | 562.5 | 2828 | 1969 | 3058 |
| 10 YR Norm (2011-2020) | 23.4 | 8.9 | 22.6 | 505.5 | 2904 | 2030 | 3276 |
| BRANTFORD | |||||||
| 2025 | 30.1 | 8.7 | 30.9 | 401.1 | 2904 | 2056 | 3083 |
| 2024 | 28.8 | 11.7 | 20.9 | 481.1 | 3029 | 2149 | 3313 |
| 2023 | 24.4 | 2.4 | 0.3 | 446.4 | 2802 | 1941 | 3014 |
| 10 YR Norm (2011-2020) | 25.4 | 9.0 | 13.9 | 428.8 | 2911 | 2041 | 3249 |
| WELLAND | |||||||
| 2025 | 28.9 | 8.3 | 19.9 | 333.5 | 2954 | 2097 | 3189 |
| 2024 | 29.0 | 10.3 | 7.0 | 479.6 | 3108 | 2224 | 3431 |
| 2023 | 23.1 | 6.7 | 1.0 | 507.8 | 2864 | 1997 | 3108 |
| 10 YR Norm (2011-2020) | 24.1 | 8.7 | 16.6 | 448.2 | 2923 | 2048 | 3302 |
| GODERICH | |||||||
| 2025 | 25.2 | 10.5 | 21.7 | 322.6 | 2741 | 1896 | 2969 |
| 2024 | 26.3 | 12.5 | 6.8 | 376.6 | 2870 | 1997 | 3150 |
| 2023 | 25.2 | 6.0 | 0.0 | 378.3 | 2638 | 1795 | 2833 |
| 10 YR Norm (2011-2020) | 22.9 | 9.7 | 18.4 | 444.3 | 2685 | 1820 | 3044 |
| ELORA | |||||||
| 2025 | 27.2 | 8.2 | 57.9 | 443.2 | 2679 | 1843 | 2871 |
| 2024 | 27.2 | 10.9 | 10.9 | 436.2 | 2808 | 1936 | 3063 |
| 2023 | 22.7 | 2.3 | 6.4 | 484.5 | 2598 | 1754 | 2766 |
| 10 YR Norm (2011-2020) | 22.5 | 7.3 | 21.5 | 499.0 | 2624 | 1763 | 2919 |
| MOUNT FOREST | |||||||
| 2025 | 25.8 | 8.1 | 16.9 | 390.1 | 2686 | 1853 | 2889 |
| 2024 | 26.3 | 10.2 | 7.6 | 409.0 | 2807 | 1940 | 3078 |
| 2023 | 23.2 | 3.1 | 0.1 | 416.6 | 2594 | 1755 | 2772 |
| 10 YR Norm (2011-2020) | 22.1 | 7.9 | 18.8 | 508.3 | 2616 | 1763 | 2946 |
| BARRIE | |||||||
| 2025 | 24.7 | 7.4 | 22.3 | 336.6 | 2683 | 1846 | 2877 |
| 2024 | 26.2 | 8.7 | 14.3 | 573.1 | 2758 | 1890 | 3023 |
| 2023 | 22.7 | 1.8 | 0.3 | 509.2 | 2599 | 1754 | 2786 |
| 10 YR Norm (2011-2020) | 22.5 | 6.7 | 18.4 | 451.7 | 2581 | 1732 | 2886 |
| PETERBOROUGH | |||||||
| 2025 | 26.8 | 0.3 | 25.5 | 363.3 | 2706 | 1860 | 2855 |
| 2024 | 28.0 | 6.6 | 35.6 | 481.4 | 2792 | 1919 | 2995 |
| 2023 | 24.2 | 0.6 | 11.1 | 441.5 | 2649 | 1792 | 2786 |
| 10 YR Norm (2011-2020) | 23.8 | 5.0 | 11.9 | 440.5 | 2650 | 1789 | 2904 |
| KEMPTVILLE | |||||||
| 2025 | 26.8 | -1.4 | 7.3 | 295.8 | 2847 | 1997 | 3042 |
| 2024 | 27.7 | 11.0 | 1.1 | 553.7 | 2965 | 2092 | 3259 |
| 2023 | 24.1 | 4.2 | 6.7 | 522.6 | 2820 | 1968 | 3008 |
| 10 YR Norm (2011-2020) | 23.0 | 6.4 | 18.4 | 497.0 | 2786 | 1926 | 3109 |
| SUDBURY | |||||||
| 2025 | 21.8 | 1.8 | 10.2 | 376.4 | 2400 | 1596 | 2606 |
| 2024 | 26.8 | 9.9 | 20.6 | 521.3 | 2622 | 1779 | 2880 |
| 2023 | 23.7 | 1.0 | 0.0 | 529.5 | 2450 | 1647 | 2632 |
| 10 YR Norm (2011-2020) | 20.9 | 6.3 | 30.7 | 484.6 | 2440 | 1641 | 2766 |
| EARLTON | |||||||
| 2025 | 23.0 | -2.8 | 4.8 | 386.9 | 2311 | 1524 | 2493 |
| 2024 | 27.4 | 4.7 | 23.9 | 508.2 | 2567 | 1731 | 2778 |
| 2023 | 25.0 | -0.2 | 0.0 | 407.5 | 2405 | 1600 | 2557 |
| 10 YR Norm (2011-2020) | 20.6 | 4.5 | 17.7 | 449.2 | 2273 | 1496 | 2548 |
| SAULT STE MARIE | |||||||
| 2025 | 21.6 | 8.9 | 11.3 | 434.3 | 2406 | 1594 | 2599 |
| 2024 | 24.9 | 7.6 | 16.0 | 537.8 | 2475 | 1617 | 2680 |
| 2023 | 25.6 | 3.3 | 0.0 | 398.6 | 2399 | 1594 | 2554 |
| 10 YR Norm (2011-2020) | 21.4 | 7.0 | 18.4 | 497.5 | 2260 | 1462 | 2496 |
| THUNDER BAY | |||||||
| 2025 | 22.9 | 6.1 | 0.4 | 411.2 | 2244 | 1460 | 2463 |
| 2024 | 29.6 | 0.7 | 2.1 | 345.1 | 2381 | 1547 | 2545 |
| 2023 | 27.0 | 1.2 | 5.0 | 310.0 | 2259 | 1477 | 2446 |
| 10 YR Norm (2011-2020) | 18.9 | 4.3 | 18.5 | 439.2 | 2189 | 1400 | 2401 |
| FORT FRANCES | |||||||
| 2025 | 25.6 | 4.6 | 4.5 | 412.9 | 2443 | 1625 | 2674 |
| 2024 | 28.7 | 1.3 | 14.3 | 490.3 | 2471 | 1627 | 2684 |
| 2023 | 28.0 | 4.6 | 30.8 | 343.2 | 2421 | 1632 | 2636 |
| 10 YR Norm (2011-2020) | 20.3 | 3.9 | 24.0 | 443.4 | 2316 | 1509 | 2555 |
This weather summary is compiled by OMAFA using Environment Canada weather station data provided by Agriculture and Agri-Food Canada. Data quality is verified but accuracy is not guaranteed and should be used for general information purposes only. For additional locations and weather analysis, visit the OMAFA Pest and Weather System (PAWS)
One thought on “Crop Report – September 25, 2025”
Comments are closed.