
Finding and Fixing Soil Compaction
When it comes to spring seeding, there can be challenges on the weather and soil conditions fronts. Areas in Ontario that often struggle with planting conditions had crops planted under good soil conditions and in record time this spring, while other areas, even some with lighter soils, experienced delays due to rainfall.
With the wet, cool conditions through much of the seeding period, some planting occurred into slightly to moderately wet soils. Soil compaction happens when heavy loads are driven on soils that are too wet to carry those loads. Those same soils in mid-season, when conditions are typically drier, would often handle the weight that overwhelmed soil strength in the spring, resulting in soil compaction. Numerous compaction events over the last few years have really demonstrated the difference in soil load strength in wet versus dry soils. The St. Clair Regional Soil and Crop Association, in partnership with the Ontario Soil Compaction Team, is hosting a compaction event in Rutherford, Ontario on August 7th. (https://www.eventbrite.com/e/st-clair-region-soil-crop-improvement-association-compaction-event-tickets-1263916701879)
Patience must be employed to help avoid compacting and damaging soils.
The biggest challenge with going too early is the impact that big equipment and fast speed can have. The implements tend to be heavier and covers many acres per day. Even starting a half day too soon in terms of soil moisture, can lead to a lot of acres being damaged.
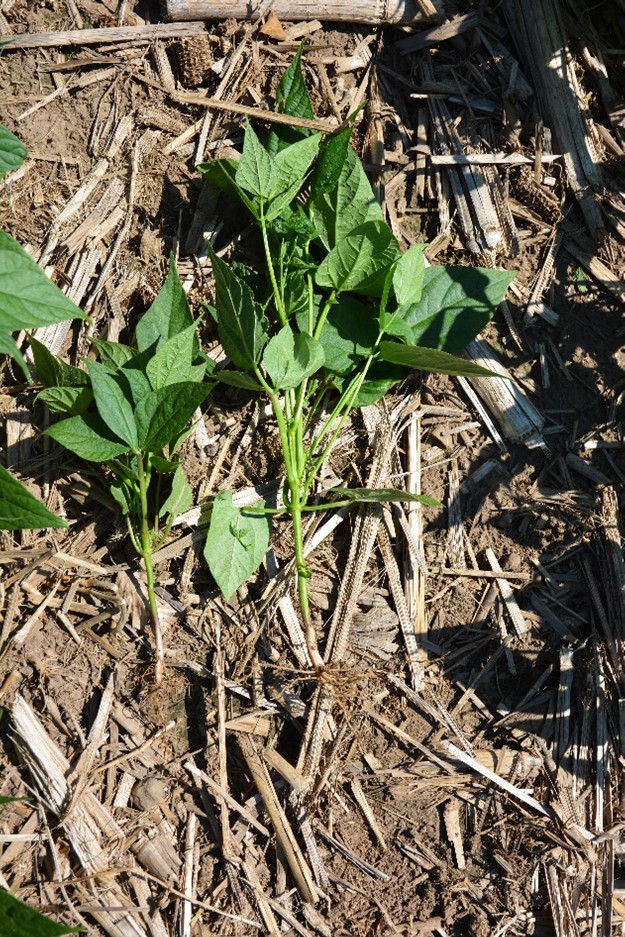
To date, crops have looked relatively good because the weather has, for the most part and across much of the province, provided excellent soil moisture for crop growth. However, last week in the 2nd heat wave of the summer, corn began curling up and soybean leaves flipped over, trying to fend off the heat and lack of soil moisture. This is when the damage from compaction in the spring really starts to appear. Now is the time to get out in the field and diagnose the problems in parts of the field that are showing stress. There are many factors that impact crop growth, and they don’t tend to happen alone. Soil compaction created at planting or previously with manure, fertilizer, tillage, and planting equipment will contribute to crop impacts through loss of soil pore space, which impacts water infiltration, air movement, gas exchange, nutrient cycling, pest control, and crop growth and development. (Figure 1)
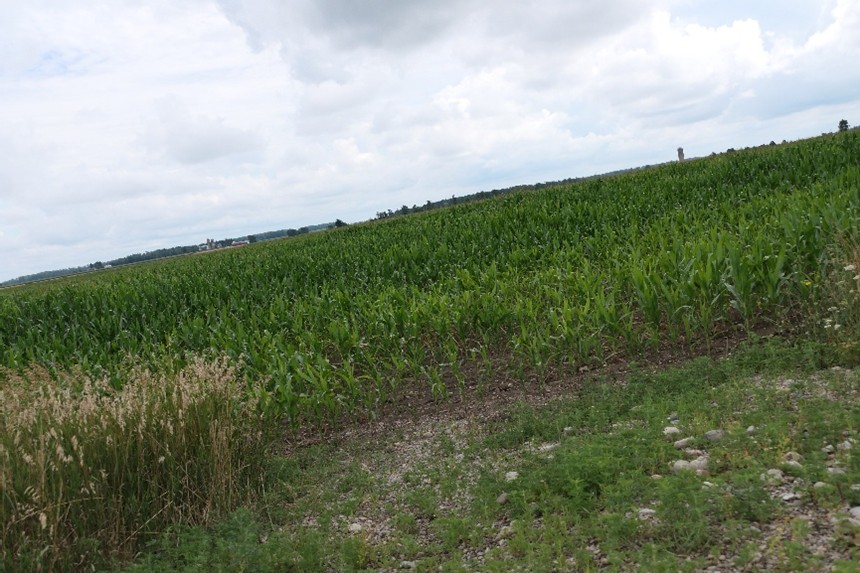
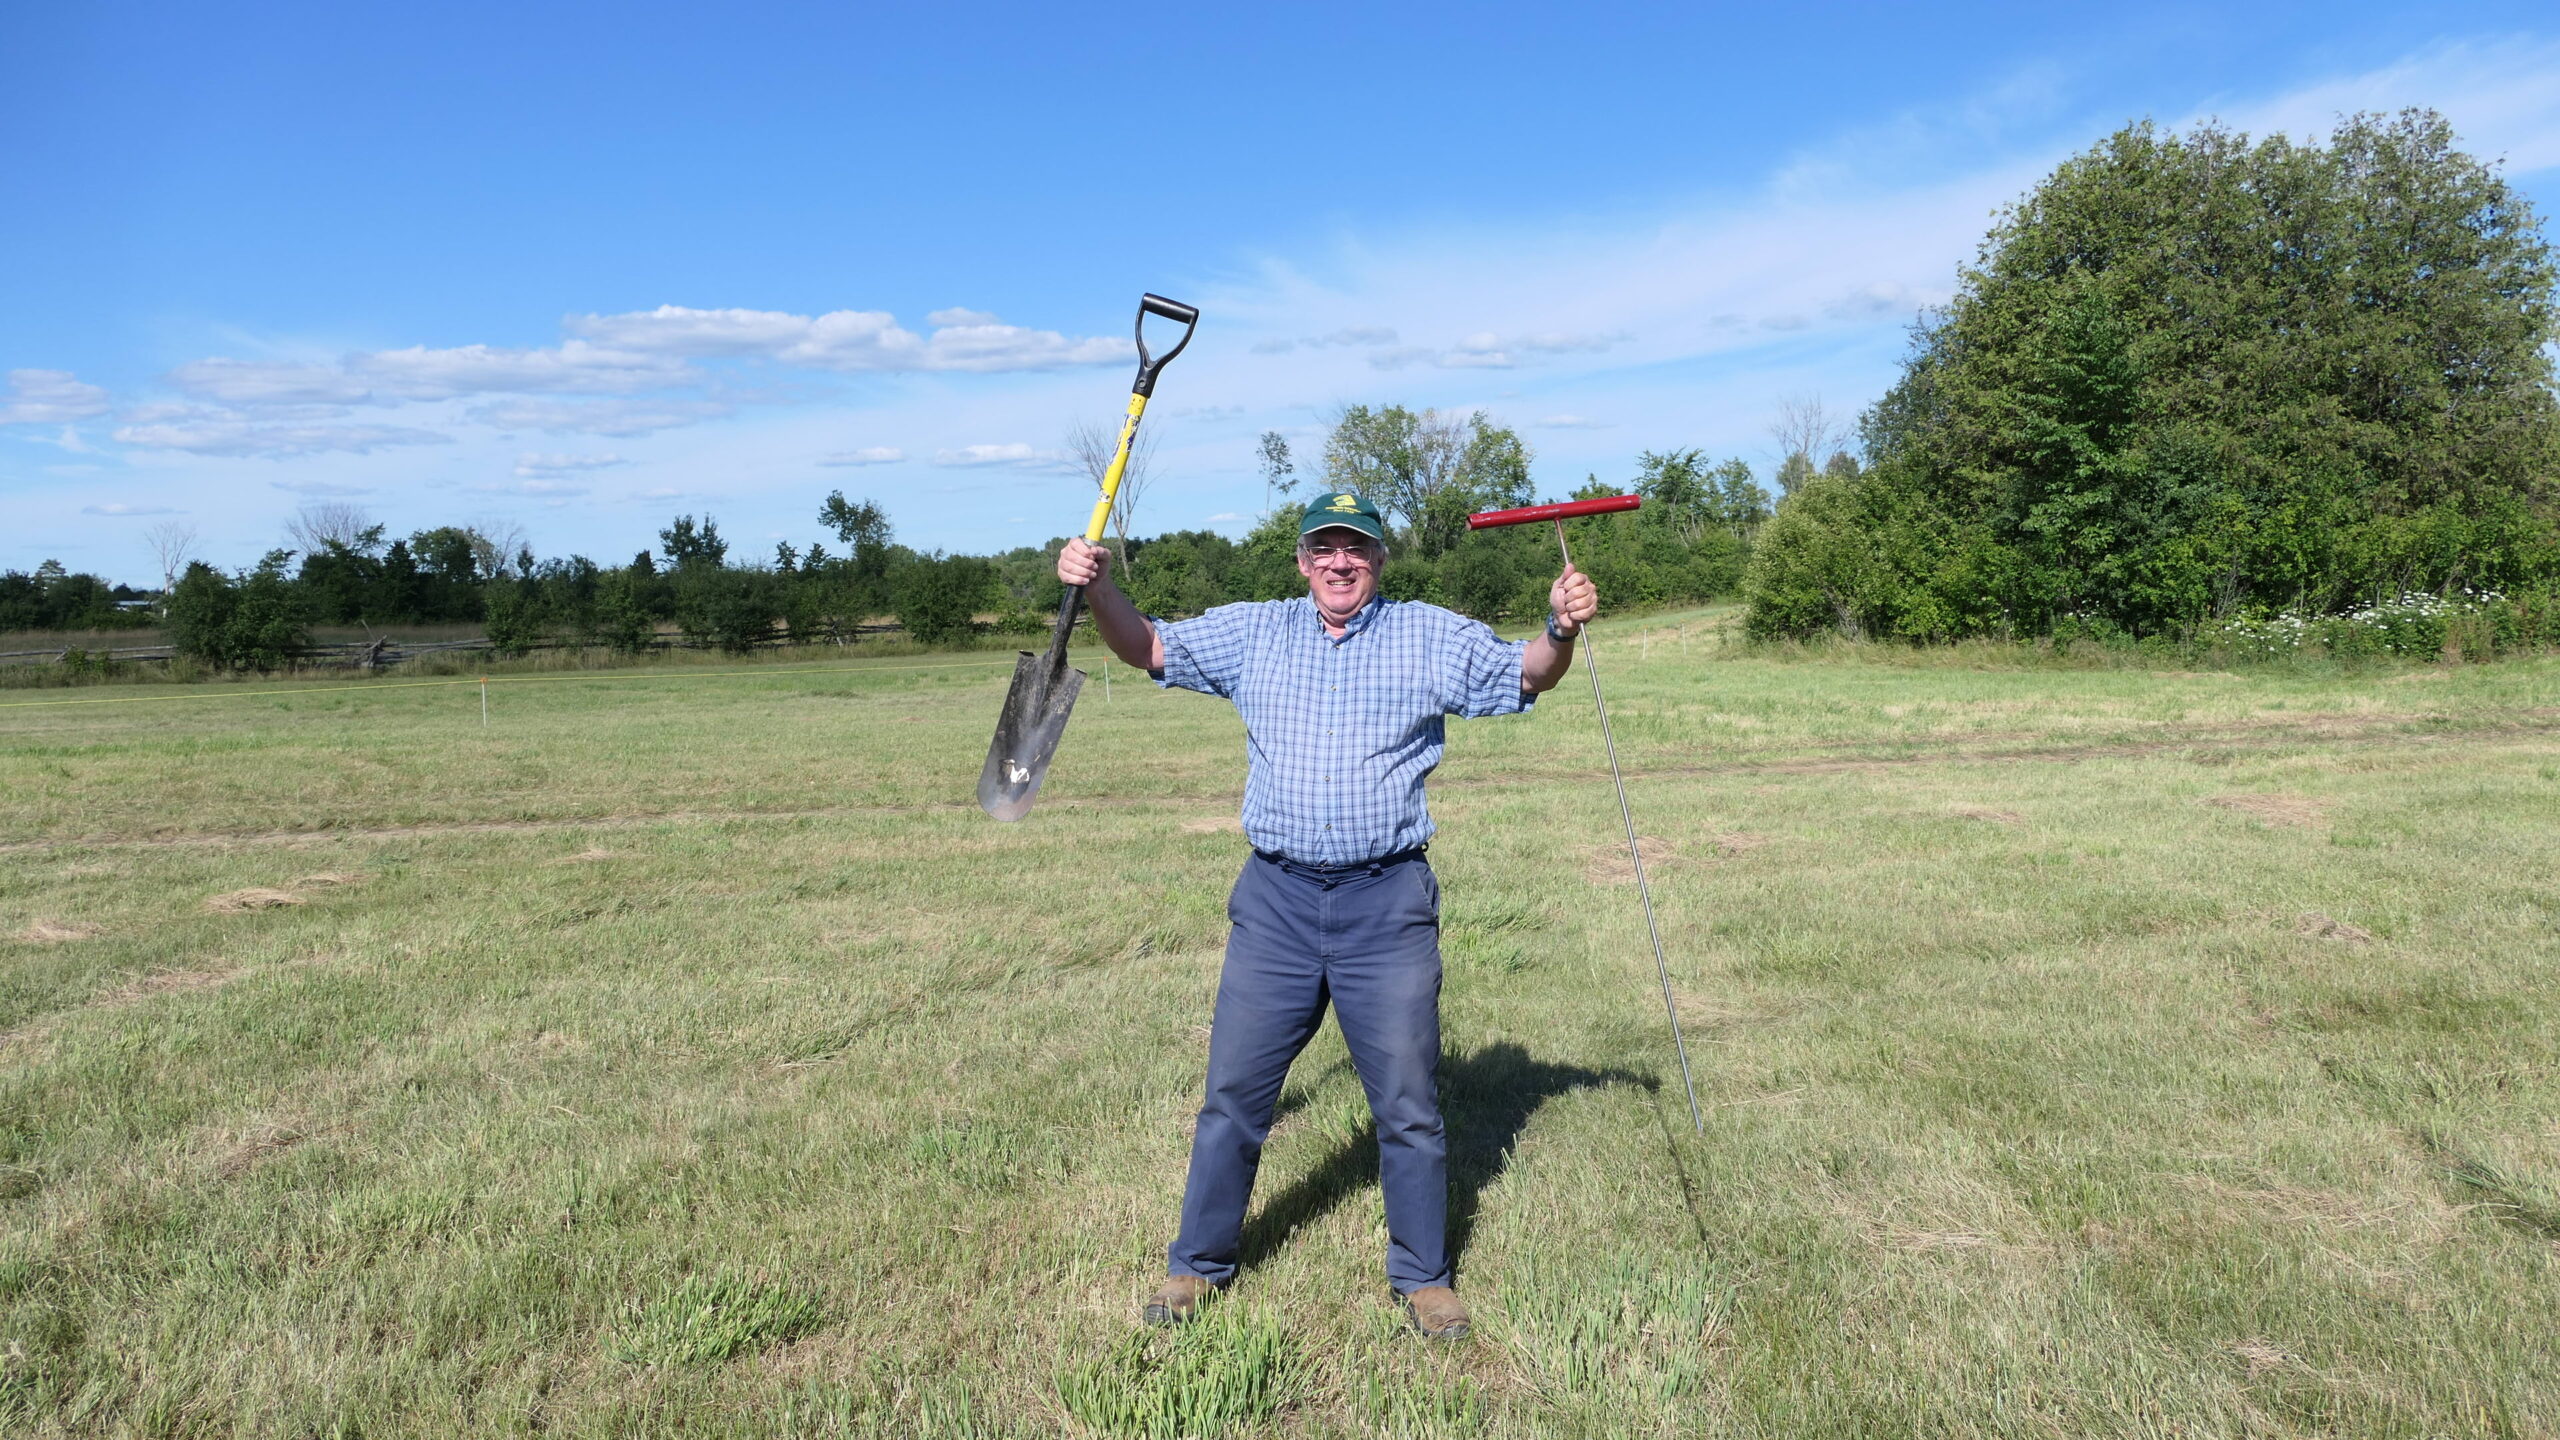
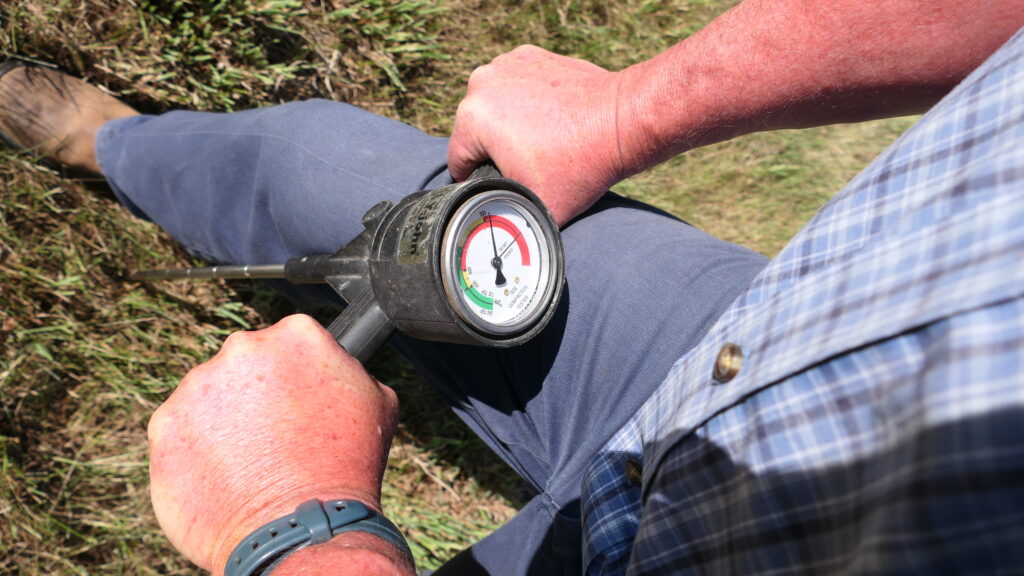
When diagnosing soil compaction, one thing to look for is straight lines of poor crop development in the field that are the tire paths of the implements. The lines might not be perfectly straight or smooth because of the interaction with other natural conditions, including rainfall, variation in soil moisture, disease, weeds, insects, topography, etc. The way to check how much compaction is part of the issue is to use the two most important tools that should be in every farm truck: a shovel and a tile probe (or compaction meter) (Figure 2). You can contact your local drainage contractor to likely knows where to purchase tile probes.
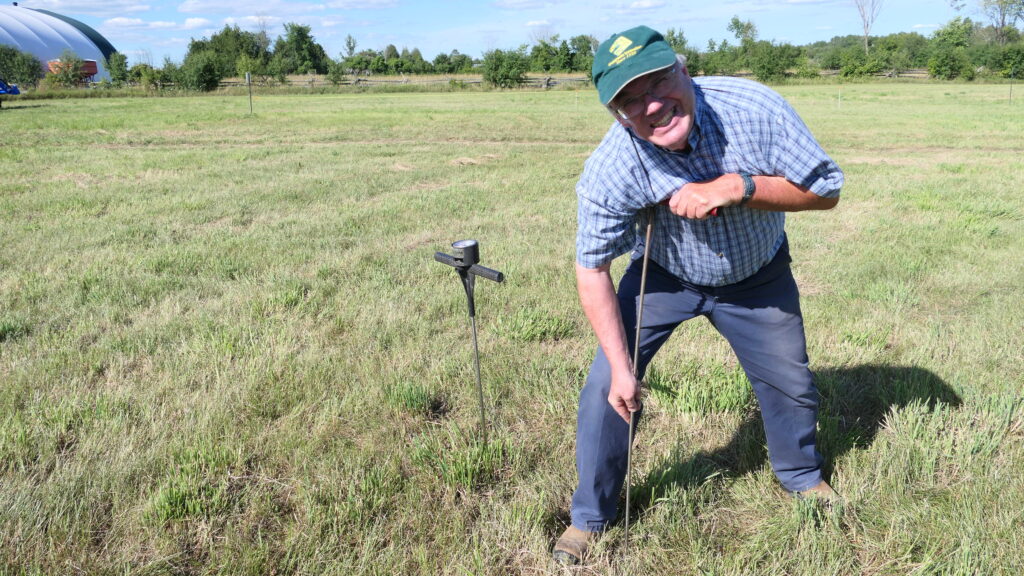
Start with the tile probe and in areas of visual crop impairment, push the probe into the ground steadily, looking for areas and depths that are harder to push through (Figure 3). Do not use the tile probe on wet soil, because the soil strength is reduced by the lubricating effect of soil moisture between soil particles. This reduces the interparticle friction between soil particles and lets the probe slide easily through otherwise compacted layers. Get a feel for the extent of the area where compaction occurs.
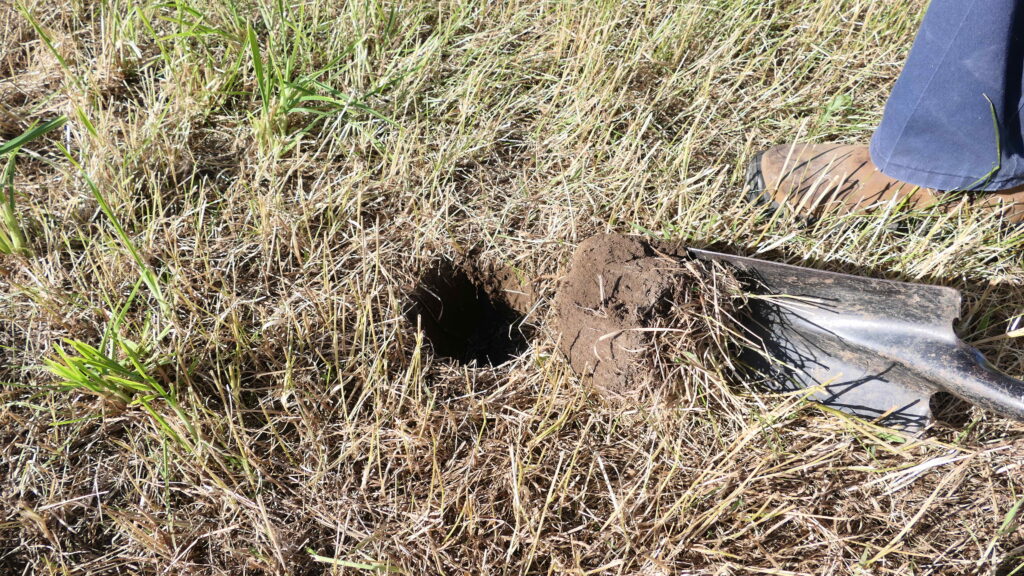
It is also often good to take the shovel and dig a hole below the depth where the resistance was detected. Look for smearing, dense layers, plow pans, etc. (Figure 4). The next two important steps are determining how widespread and how deep the compaction is. Knowing this allows you to manage the soil compaction that is causing crop issues without having to apply the remedy to the entire field. Compaction tends to occur in discrete patches because of the variation in soil texture, moisture, and strength across the field. To fix the problem, fix the problem areas only. It’s a strain on time and fuel to do the whole field if it doesn’t need it.
To lower your risk of soil compaction, lower the load, lower the tire pressure, and lower the soil moisture before traveling across the fields.
The most common decision to remedy compaction is to apply tillage. Tillage depth should be only a couple of inches below the determined depth of the compaction layer. The tillage should be done when the soil is dry. Dry soil shatters and is less likely to smear. Confine the remediation to the area of the field that really needs it. Longer-term solutions involve crop rotations, cover crops, changes in tillage practice (less is more) and others. Consult Field Crop News (https://fieldcropnews.com/soil-compaction/)for more information on soil compaction.
OMAFA Weather Summary: Thurs July 17—Wed July 23, 2025
| Location | Highest Temp (°C) | Lowest Temp (°C) | Rain for Week (mm) | Rain Since April 1st (mm) | GDD0C April 1st | GDD5C April 1st | CHU May 1st |
| HARROW | |||||||
| 2025 | 27.9 | 12.2 | 15.3 | 321.8 | 1838 | 1291 | 1857 |
| 2024 | 27.4 | 11.6 | 0.3 | 319.2 | 1992 | 1421 | 2037 |
| 2023 | 28.9 | 14.0 | 15.1 | 288.8 | 1779 | 1220 | 1788 |
| 10 YR Norm (2011-2020) | 29.2 | 17.7 | 14.1 | 351.1 | 1829 | 1261 | 1950 |
| RIDGETOWN | |||||||
| 2025 | 29.0 | 9.9 | 0.8 | 240.8 | 1744 | 1199 | 1738 |
| 2024 | 27.4 | 9.7 | 1.8 | 433.0 | 1884 | 1316 | 1916 |
| 2023 | 27.8 | 12.0 | 31.3 | 379.6 | 1687 | 1136 | 1662 |
| 10 YR Norm (2011-2020) | 29.0 | 15.9 | 17.9 | 300.0 | 1719 | 1156 | 1816 |
| SARNIA | |||||||
| 2025 | 29.6 | 11.5 | 14.9 | 382.6 | 1696 | 1156 | 1654 |
| 2024 | 28.3 | 11.5 | 1.0 | 374.2 | 1867 | 1303 | 1878 |
| 2023 | 28.9 | 13.0 | 24.5 | 276.3 | 1645 | 1096 | 1582 |
| 10 YR Norm (2011-2020) | 29.2 | 17.2 | 18.4 | 318.3 | 1676 | 1115 | 1765 |
| LONDON | |||||||
| 2025 | 28.1 | 9.2 | 7.4 | 272.7 | 1660 | 1136 | 1684 |
| 2024 | 28.5 | 10.4 | 1.5 | 464.5 | 1859 | 1289 | 1900 |
| 2023 | 27.5 | 12.2 | 11.4 | 337.1 | 1680 | 1130 | 1659 |
| 10 YR Norm (2011-2020) | 29.2 | 16.2 | 20.2 | 323.2 | 1695 | 1136 | 1793 |
| BRANTFORD | |||||||
| 2025 | 30.7 | 9.7 | 3.8 | 312.3 | 1688 | 1155 | 1672 |
| 2024 | 28.8 | 10.6 | 1.6 | 391.4 | 1805 | 1239 | 1849 |
| 2023 | 28.0 | 11.7 | 8.6 | 294.5 | 1670 | 1119 | 1650 |
| 10 YR Norm (2011-2020) | 30.0 | 15.4 | 11.1 | 281.7 | 1679 | 1123 | 1759 |
| WELLAND | |||||||
| 2025 | 29.9 | 9.6 | 3.5 | 211.2 | 1739 | 1197 | 1754 |
| 2024 | 27.2 | 11.8 | 0.3 | 391.9 | 1865 | 1296 | 1928 |
| 2023 | 27.1 | 13.8 | 14.8 | 300.9 | 1689 | 1132 | 1665 |
| 10 YR Norm (2011-2020) | 28.7 | 16.9 | 11.2 | 302.0 | 1701 | 1141 | 1802 |
| GODERICH | |||||||
| 2025 | 28.4 | 8.3 | 1.2 | 217.5 | 1589 | 1059 | 1587 |
| 2024 | 27.1 | 9.2 | 1.0 | 262.5 | 1680 | 1122 | 1697 |
| 2023 | 26.9 | 11.9 | 19.6 | 236.6 | 1539 | 1006 | 1499 |
| 10 YR Norm (2011-2020) | 26.9 | 15.3 | 18.9 | 269.1 | 1528 | 978 | 1607 |
| ELORA | |||||||
| 2025 | 27.8 | 8.0 | 19.3 | 300.0 | 1553 | 1032 | 1554 |
| 2024 | 27.3 | 8.5 | 3.6 | 345.5 | 1680 | 1123 | 1726 |
| 2023 | 27.4 | 10.1 | 37.7 | 307.7 | 1540 | 1006 | 1513 |
| 10 YR Norm (2011-2020) | 27.8 | 13.6 | 15.2 | 316.5 | 1522 | 976 | 1597 |
| MOUNT FOREST | |||||||
| 2025 | 28.1 | 8.0 | 10.9 | 258.6 | 1550 | 1031 | 1546 |
| 2024 | 26.2 | 8.3 | 2.6 | 332.4 | 1660 | 1107 | 1704 |
| 2023 | 27.1 | 11.0 | 5.1 | 296.7 | 1537 | 1008 | 1514 |
| 10 YR Norm (2011-2020) | 27.1 | 13.9 | 19.5 | 318.3 | 1502 | 964 | 1593 |
| BARRIE | |||||||
| 2025 | 27.4 | 6.6 | 1.7 | 223.7 | 1544 | 1022 | 1556 |
| 2024 | 26.1 | 9.9 | 4.2 | 500.9 | 1620 | 1067 | 1675 |
| 2023 | 26.9 | 11.0 | 24.0 | 383.3 | 1527 | 992 | 1508 |
| 10 YR Norm (2011-2020) | 27.3 | 13.9 | 11.9 | 284.2 | 1483 | 948 | 1568 |
| PETERBOROUGH | |||||||
| 2025 | 28.3 | 7.0 | 11.1 | 243.3 | 1594 | 1063 | 1594 |
| 2024 | 28.8 | 9.5 | 0.0 | 346.6 | 1672 | 1114 | 1700 |
| 2023 | 27.8 | 9.0 | 35.7 | 300.3 | 1571 | 1024 | 1509 |
| 10 YR Norm (2011-2020) | 28.6 | 12.8 | 10.9 | 278.0 | 1543 | 997 | 1602 |
| KEMPTVILLE | |||||||
| 2025 | 29.3 | 6.9 | 14.7 | 242.3 | 1666 | 1132 | 1682 |
| 2024 | 28.1 | 11.9 | 1.2 | 376.4 | 1762 | 1204 | 1829 |
| 2023 | 29.3 | 11.2 | 13.8 | 315.0 | 1685 | 1144 | 1645 |
| 10 YR Norm (2011-2020) | 29.0 | 15.3 | 14.8 | 306.3 | 1619 | 1074 | 1704 |
| SUDBURY | |||||||
| 2025 | 27.9 | 5.6 | 38.8 | 296.4 | 1349 | 860 | 1399 |
| 2024 | 24.8 | 10.2 | 21.3 | 398.8 | 1499 | 971 | 1567 |
| 2023 | 26.7 | 9.1 | 31.6 | 401.0 | 1442 | 949 | 1460 |
| 10 YR Norm (2011-2020) | 27.3 | 13.0 | 13.5 | 293.4 | 1374 | 890 | 1493 |
| EARLTON | |||||||
| 2025 | 28.1 | 6.9 | 21.4 | 303.3 | 1304 | 832 | 1364 |
| 2024 | 26.6 | 7.7 | 9.4 | 344.7 | 1478 | 957 | 1542 |
| 2023 | 27.5 | 7.7 | 11.5 | 253.0 | 1426 | 932 | 1445 |
| 10 YR Norm (2011-2020) | 26.7 | 11.3 | 18.3 | 266.2 | 1279 | 817 | 1395 |
| SAULT STE MARIE | |||||||
| 2025 | 28.7 | 7.7 | 14.2 | 265.2 | 1303 | 806 | 1293 |
| 2024 | 23.6 | 10.0 | 11.2 | 384.7 | 1372 | 829 | 1359 |
| 2023 | 26.1 | 10.3 | 23.8 | 260.6 | 1371 | 875 | 1347 |
| 10 YR Norm (2011-2020) | 26.4 | 11.8 | 23.4 | 297.1 | 1227 | 744 | 1276 |
| THUNDER BAY | |||||||
| 2025 | 27.0 | 7.9 | 53.6 | 311.9 | 1202 | 734 | 1268 |
| 2024 | 27.3 | 6.2 | 0.6 | 278.1 | 1276 | 757 | 1256 |
| 2023 | 26.7 | 7.0 | 14.8 | 198.7 | 1256 | 784 | 1297 |
| 10 YR Norm (2011-2020) | 26.3 | 11.1 | 16.1 | 294.0 | 1195 | 721 | 1257 |
| FORT FRANCES | |||||||
| 2025 | 27.0 | 4.6 | 48.0 | 313.0 | 1389 | 885 | 1451 |
| 2024 | 28.1 | 6.2 | 6.4 | 345.2 | 1344 | 815 | 1356 |
| 2023 | 26.6 | 10.5 | 36.1 | 230.5 | 1425 | 946 | 1510 |
| 10 YR Norm (2011-2020) | 27.3 | 11.1 | 18.2 | 286.2 | 1321 | 829 | 1417 |
This weather summary is compiled by OMAFA using Environment Canada weather station data provided by Agriculture and Agri-Food Canada. Data quality is verified but accuracy is not guaranteed and should be used for general information purposes only. For additional locations and weather analysis, visit the OMAFA Pest and Weather System (PAWS)