Spring has returned following a cold, snowy winter; however, weather conditions through March and early April remains cooler than normal, and soils continue to be wet and cool in many areas. As a result, meaningful field activity has been minimal to date across the province.
Ontario field crop producers are entering the 2026 growing season with cautious optimism. Market conditions remain supportive for crop production but rising input costs and ongoing supply uncertainties underline the importance of careful planning. Producers are encouraged to review cost of production budgets and cropping plans to ensure operations remain both profitable and sustainable.
Spring can be a high‑stress period for many farm operators. It is important to remember that support programs are available. Producers in need of assistance can contact the Farmer Wellness Initiative at 1‑866‑267‑6255 for confidential support, or call or text 9‑8‑8 if they are in crisis.
Fertilizer decisions
Fertilizer availability has been a key question heading into the 2026 season.
Producers are strongly encouraged to communicate early with their fertilizer suppliers to confirm product availability and application plans.
In response to higher nitrogen costs, some producers are considering modest reductions in nitrogen rates, typically in the range of 5–10%, in corn production. There has also been increased interest in decision‑support tools such as the Ontario Corn Nitrogen Calculator to help refine economically optimal rates. Phosphorus and potassium rates may also be adjusted slightly, including reductions in starter fertilizer of 10–20%, to better align nutrient investments with expected returns.
Among all fertility decisions, a current soil test remains the highest‑value input. Without recent soil test information, fertilizer decisions are largely guesswork. Accurate soil testing allows nutrients to be targeted where they provide the greatest yield and economic response.
Winter Cereals
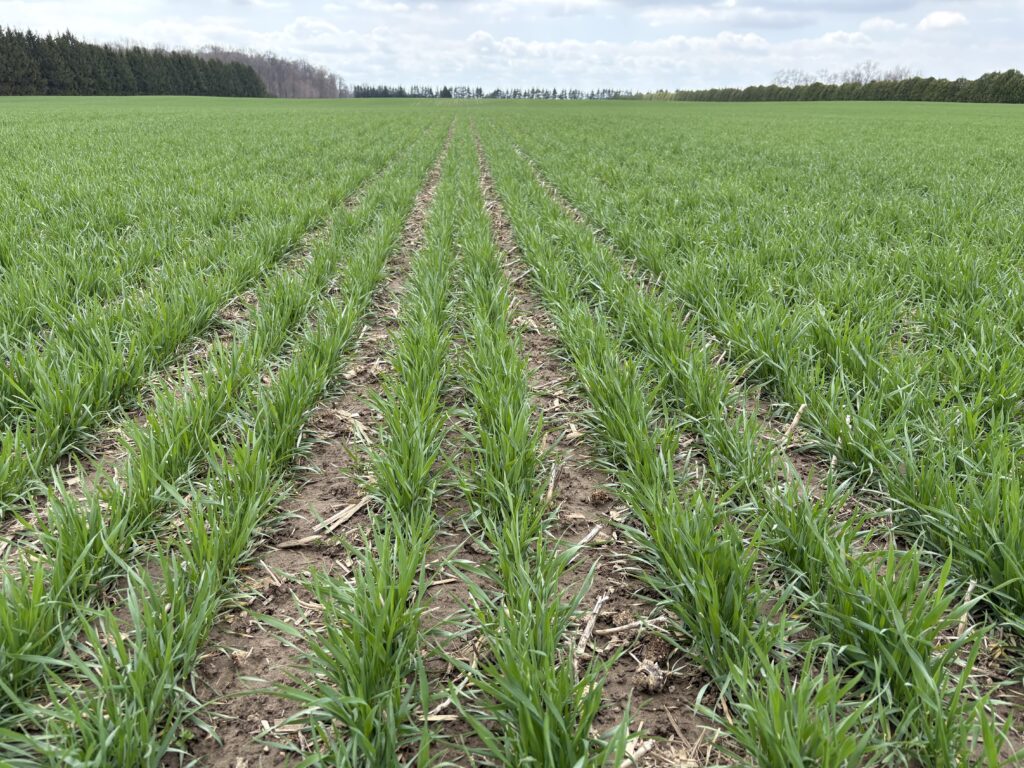
Winter wheat across much of southwestern Ontario is in good or excellent condition, although some weaker stands exist, particularly on heavier soils or late planted fields. Snow mould and winterkill have been reported in localized areas north and east of London. Triticale and rye appear to be more affected by snow mould than winter wheat.
Approximately 10% of the winter wheat acreage has received nitrogen and sulphur applications to date, although this varies widely by area. Ongoing precipitation is expected to limit short‑term progress, but the crop is not currently showing visual symptoms of nitrogen or sulphur deficiency. Losses from early fertilizer applications are anticipated to be minimal, provided product was not applied immediately before significant runoff or heavy rainfall events.
Winter Canola
Winter canola survival has been more variable than winter cereals. An estimated 65–75% of acres look to be in good condition. Fields established under dry fall conditions or that emerged late show more uneven stands and increased evidence of heaving this spring.
Soybean Seed Quality
Soybean seed quality has emerged as a concern this spring with some seed lots. Dry conditions during the 2025 harvest resulted in thin seed coats, leading to increased cracking and variability in germination. Producers are encouraged to review seed tags carefully, pay close attention to germination and when available, vigour ratings. Handle seed gently to minimize damage. Excessive air pressure in air seeders should be avoided, as it can further damage fragile seed coats.
Where seed quality is a concern, the trend toward very early soybean planting should be approached cautiously. Reduced vigour increases the risk of emergence issues under cool or stressful early‑season conditions. Close attention to soil conditions and short‑term weather forecasts will be important when making planting decisions with these seed lots.
Weeds and Herbicide Resistance
Herbicide resistance continues to expand across Ontario and remains a significant agronomic challenge. Palmer amaranth has now been confirmed in several counties. One eastern Ontario population has displayed resistance to herbicide Groups 2, 5, 9 and 27. Of significance, while this population was resistant to atrazine (a group 5 triazine), it was susceptible to metribuzin (a group 5 triazinone). In fact, all bioassay testing of pigweed species (redroot, green, waterhemp and palmer) were resistant to atrazine but susceptible to metribuzin. This illustrates that metribuzin is still a very useful active ingredient in soybean weed control. Management strategies for Palmer Amaranth like those used for waterhemp are recommended, with a strong emphasis on preventing seed production. Waterhemp remains the more significant broadleaf weed challenge at this time. OMAFA’s CropIPM can assist with positive identification of both Palmer Amaranth and waterhemp.
For information on how to test for herbicide resistance, and to access the database showing distribution in Ontario over the last 30 years, go to: https://cropprotectionhub.omafra.gov.on.ca/weed-control/herbicide-resistant-weeds-database-and-maps
Pre‑emergence herbicides are a cornerstone of integrated weed management strategies in southwestern Ontario. Equipment sanitation is increasingly important to reduce the spread of resistant weed seed. Early detection and proactive control are far more cost‑effective than post‑emergence rescue treatments, particularly when long‑term yield losses are considered.
Agribusiness Breakfast Meetings
The crop report was informed by the first agribusiness breakfast meeting of 2026, held on April 7 in Ridgetown. For information on upcoming local meetings across Ontario, please contact margaret.templeman@ontario.ca.
OMAFA Weather Summary: Thurs April 9 – Wed April 15, 2026
| Location | Highest Temp (°C) | Lowest Temp (°C) | Rain for Week (mm) | Rain Since April 1st (mm) | GDD0C April 1st | GDD5C April 1st |
| HARROW | ||||||
| 2026 | 26.6 | 3.2 | 35.0 | 67.7 | 149 | 83 |
| 2025 | 16.9 | -5.8 | 14.0 | 67.8 | 79 | 27 |
| 2024 | 25.3 | 5.5 | 31.4 | 58.9 | 146 | 67 |
| 10 YR Norm (2011-2020) | 14.3 | 1.7 | 19.8 | 37.9 | 97 | 24 |
| RIDGETOWN | ||||||
| 2026 | 26.3 | -2.2 | 52.2 | 75.2 | 136 | 75 |
| 2025 | 20.2 | -6.7 | 6.1 | 56.2 | 77 | 25 |
| 2024 | 25.1 | 4.5 | 48.4 | 66.1 | 133 | 56 |
| 10 YR Norm (2011-2020) | 14.3 | 0.7 | 21.2 | 36.9 | 83 | 15 |
| SARNIA | ||||||
| 2026 | 26.1 | -0.5 | 25.7 | 85.3 | 118 | 64 |
| 2025 | 23.5 | -6.9 | 8.7 | 89.2 | 69 | 22 |
| 2024 | 24.1 | 4.5 | 34.7 | 48.9 | 127 | 56 |
| 10 YR Norm (2011-2020) | 13.4 | 0.2 | 24.1 | 39.5 | 77 | 12 |
| LONDON | ||||||
| 2026 | 25.0 | -1.9 | 32.4 | 67.0 | 127 | 67 |
| 2025 | 19.3 | -7.1 | 11.2 | 84.6 | 67 | 19 |
| 2024 | 22.4 | 3.1 | 45.0 | 59.7 | 132 | 55 |
| 10 YR Norm (2011-2020) | 13.6 | -0.2 | 23.8 | 44.1 | 73 | 10 |
| BRANTFORD | ||||||
| 2026 | 23.4 | -2.8 | 40.3 | 61.7 | 113 | 55 |
| 2025 | 19.1 | -6.7 | 6.7 | 84.7 | 65 | 19 |
| 2024 | 23.5 | 1.6 | 34.8 | 44.9 | 123 | 49 |
| 10 YR Norm (2011-2020) | 12.2 | -0.9 | 16.4 | 47.1 | 66 | 5 |
| WELLAND | ||||||
| 2026 | 22.8 | -0.9 | 27.1 | 42.8 | 129 | 63 |
| 2025 | 18.4 | -7.3 | 7.8 | 42.1 | 70 | 20 |
| 2024 | 24.3 | 1.5 | 55.3 | 87.7 | 137 | 60 |
| 10 YR Norm (2011-2020) | 13.5 | 0.2 | 25.9 | 46.6 | 75 | 11 |
| GODERICH | ||||||
| 2026 | 20.6 | 0.1 | 44.6 | 88.8 | 98 | 46 |
| 2025 | 18.6 | -2.9 | 5.7 | 69.4 | 56 | 13 |
| 2024 | 23.2 | 0.6 | 36.7 | 50.2 | 112 | 43 |
| 10 YR Norm (2011-2020) | 11.6 | 0.3 | 22.9 | 37.1 | 59 | 4 |
| ELORA | ||||||
| 2026 | 21.3 | -1.4 | 58.0 | 92.8 | 94 | 44 |
| 2025 | 19.6 | -6.4 | 7.7 | 71.4 | 50 | 12 |
| 2024 | 22.5 | 1.6 | 34.8 | 54.6 | 106 | 38 |
| 10 YR Norm (2011-2020) | 12.5 | -1.0 | 24.7 | 47.4 | 53 | 2 |
| MOUNT FOREST | ||||||
| 2026 | 19.3 | -1.9 | 58.8 | 89.6 | 89 | 41 |
| 2025 | 18.9 | -7.1 | 9.5 | 72.4 | 47 | 12 |
| 2024 | 21.7 | 1.4 | 65.9 | 81.2 | 102 | 36 |
| 10 YR Norm (2011-2020) | 11.1 | -1.5 | 21.1 | 40.4 | 44 | 0 |
| BARRIE | ||||||
| 2026 | 18.9 | -2.2 | 89.5 | 111.7 | 65 | 26 |
| 2025 | 15.8 | -10.0 | 2.8 | 51.4 | 38 | 8 |
| 2024 | 21.1 | 0.2 | 66.9 | 126.9 | 94 | 29 |
| 10 YR Norm (2011-2020) | 11.6 | -2.5 | 23.2 | 40.3 | 42 | 0 |
| PETERBOROUGH | ||||||
| 2026 | 21.7 | -3.2 | 61.6 | 84.8 | 80 | 31 |
| 2025 | 15.8 | -8.2 | 3.6 | 41.1 | 49 | 9 |
| 2024 | 22.4 | -1.0 | 54.0 | 92.6 | 109 | 38 |
| 10 YR Norm (2011-2020) | 12.8 | -2.6 | 20.5 | 38.0 | 53 | 1 |
| KEMPTVILLE | ||||||
| 2026 | 19.1 | -4.0 | 40.1 | 68.7 | 75 | 28 |
| 2025 | 18.2 | -11.1 | 16.1 | 56.5 | 54 | 12 |
| 2024 | 21.7 | 1.4 | 33.1 | 83.6 | 106 | 38 |
| 10 YR Norm (2011-2020) | 13.3 | -2.1 | 25.4 | 47.2 | 54 | 4 |
| SUDBURY | ||||||
| 2026 | 11.6 | -4.2 | 35.5 | 83.3 | 23 | 2 |
| 2025 | 11.5 | -17.3 | 2.3 | 18.8 | 21 | 0 |
| 2024 | 20.4 | -0.4 | 64.7 | 101.6 | 76 | 20 |
| 10 YR Norm (2011-2020) | 9.2 | -4.5 | 20.6 | 43.8 | 10 | 0 |
| EARLTON | ||||||
| 2026 | 9.8 | -3.4 | 23.2 | 68.4 | 17 | 0 |
| 2025 | 11.6 | -17.4 | 8.6 | 19.5 | 13 | 0 |
| 2024 | 18.8 | -1.1 | 69.8 | 99.9 | 69 | 16 |
| 10 YR Norm (2011-2020) | 8.0 | -6.1 | 16.7 | 29.8 | 4 | 0 |
| SAULT STE MARIE | ||||||
| 2026 | 12.7 | -4.7 | 10.4 | 41.1 | 32 | 7 |
| 2025 | 14.9 | -13.0 | 15.5 | 24.1 | 28 | 5 |
| 2024 | 17.2 | -1.0 | 24.4 | 54.3 | 78 | 15 |
| 10 YR Norm (2011-2020) | 7.1 | -3.8 | 21.7 | 40.8 | 10 | 0 |
| THUNDER BAY | ||||||
| 2026 | 11.8 | -5.0 | 20.1 | 39.8 | 25 | 2 |
| 2025 | 14.6 | -6.2 | 19.3 | 32.0 | 13 | 0 |
| 2024 | 17.0 | -3.8 | 0.4 | 9.8 | 58 | 9 |
| 10 YR Norm (2011-2020) | 8.8 | -5.3 | 9.7 | 21.9 | 12 | 0 |
| FORT FRANCES | ||||||
| 2026 | 12.2 | -5.8 | 4.3 | 26.1 | 23 | 2 |
| 2025 | 16.1 | -3.9 | 21.4 | 27.6 | 27 | 3 |
| 2024 | 15.9 | -4.8 | 2.2 | 4.1 | 58 | 4 |
| 10 YR Norm (2011-2020) | 8.8 | -6.3 | 9.5 | 18.7 | 13 | 0 |
This weather summary is compiled by OMAFA using Environment Canada weather station data provided by Agriculture and Agri-Food Canada. Data quality is verified but accuracy is not guaranteed and should be used for general information purposes only. For additional locations and weather analysis, visit the OMAFA Pest and Weather System (PAWS)