When Weather Skews Soil Test Results
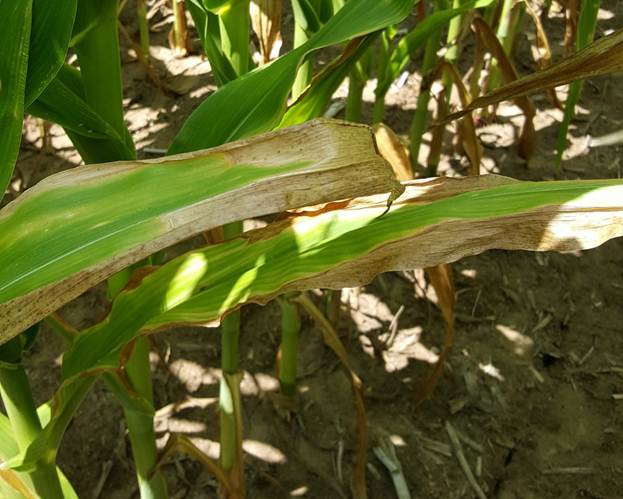
Ontario growing seasons can range from extremely wet to extremely dry, and prolonged periods of either extreme weather in season can affect crop nutrient availability. These impacts are often visible during the season as nutrient deficiencies as shown in Figure 1, but they can also influence soil test results long after the weather event has passed.
Late summer and fall are common times for soil sampling, but these periods often coincide with dry conditions following winter wheat harvest, or very wet conditions after corn or soybeans. Extremes in soil moisture can affect the extracted nutrient values reported from the laboratory and may require additional interpretation since measured values may not fully reflect the soil’s long-term fertility status.
The challenge of taking a representative sample
Ontario fertilizer recommendations are based on calibration research linking soil test values to the likelihood of crop response. These calibrations assume samples are collected at the proper depth, using a consistent method, and under reasonably normal field conditions. Since nutrient concentrations often vary with depth, inconsistent sampling can introduce significant errors.
Sampling can be particularly difficult in very dry or wet soils. Soil probes may not reach the full 15 cm (6 in.) depth, and it can be difficult to extract full cores and mix the soil adequately. The soil test results are only as accurate as the sample submitted to the laboratory.
Beyond sampling challenges, extended dry periods can alter nutrient cycling within the soil by:
- Reducing nutrient movement through the soil solution
- Slowing nutrient release from organic matter and amendments
- Decreasing biological activity involved in nutrient cycling
- Increasing seasonal variability in soil test values
Extended wet periods can also alter nutrient dynamics. Depending on the degree of saturation, moisture may increase or decrease microbial activity and nutrient release, while also increasing losses of mobile nutrients such as nitrogen, sulphur, and in some coarse-textured soils, potassium.
While moisture extremes can affect many test results temporarily, potassium (K) and soil pH values are often the most influenced on soil test analyses.
Potassium
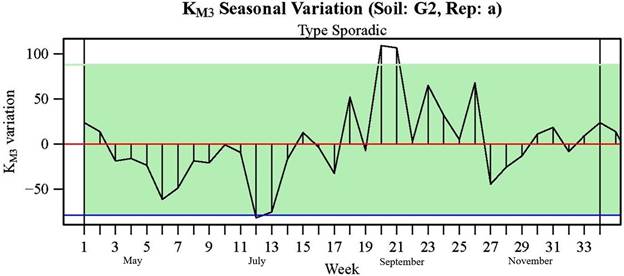
Research has shown that soil test K levels fluctuate throughout the growing season. Levels often decline during periods of rapid crop uptake and recover later as plant demand decreases, and soil moisture improves. As a result, fields sampled immediately after a dry summer may have lower-than-expected potassium availability even though the soil’s overall K-supplying capacity has not changed. Figure 2 gives an example of the variation in soil test K as tested throughout a growing corn crop.
Ontario soils contain large reserves of potassium, but only a small fraction is immediately available for plant uptake. Under normal conditions, slowly available forms of K replenish the readily available pool.
Reduced soil moisture slows potassium movement to roots and restricts replenishment from less available pools. Shrinking clay structures can trap potassium between mineral layers, reducing the amount extracted by soil tests.
Crop residue also plays an important role. Much of the potassium taken up by crops remains in plant stalks and leaves. After harvest, rainfall normally leaches K from residue back into the soil. In drought conditions, this process is delayed, leaving less potassium in the soil at sampling time.
Conversely, wet conditions can accelerate K release from crop residue and promote exchange between soil K pools which may increase soil test values following harvest. While this can temporarily increase measured availability, it may also increase the risk of K loss before the nutrient is taken up by a future crop.
Soil pH
Soil moisture can also influence measured pH values. Dry soils cause lime to react more slowly and reduce the neutralization of acidity near the soil surface. Combined with the acidifying effects of ammonium-based fertilizers, soil pH may test lower than expected. Waterlogged soils often have the opposite effect: as oxygen becomes depleted, microbial processes consume hydrogen ions, causing soil pH to increase.
Research has demonstrated that increasing soil moisture from very dry conditions to field capacity can raise measured pH. Extremely dry soils may test approximately 0.1 to 0.5 pH units lower than expected, while samples collected after prolonged wet conditions may test somewhat higher than normal.
Importantly, buffer pH measurements used to determine lime requirements are generally unaffected by soil moisture conditions.
What does this mean for fertility recommendations?
The best way to interpret results from samples taken at extremely dry or wet times is to compare them with historical records. Sampling at the same point in the rotation, at a similar time of year, and using a consistent sampling pattern helps build a valuable long-term dataset.
For example, if soil K levels have been stable for many years and a drought-year sample shows a sudden decline despite similar fertility management, the result should be interpreted cautiously. The lower value may reflect temporary moisture-related effects rather than a true reduction in soil fertility. Table 1 gives an example of these moisture-related effects to soil test values.
Table 1. Effect of prolonged wet or dry soil conditions on soil test analysis readings compared to normal sampling conditions.
| Soil test analysis | How soil test values read compared to normal | |
| Droughty soil | Waterlogged soil | |
| Potassium (K) | Lower | May be higher |
| Soil pH | Lower (more acidic) | Higher (more basic) |
| Buffer pH | Unchanged | Unchanged |
Ultimately, soil fertility planning should incorporate current soil test values with context: historical trends, crop removal rates, nutrient management practices, and recent weather conditions. When soil moisture has been unusually dry or wet, understanding the impact of those conditions on soil test results can help avoid overreacting to temporary changes while still maintaining productivity and profitability goals.
References
- Vogel, S., Emmerich, K., Schroter, I., et al. 2024. The effect of soil moisture content and soil texture on fast in situ pH measurements with two types of robust ion-selective electrodes. SOIL 10:321-333.
- Chelabi, H., Khiara, L., and Gallichand, J. 2021. Temporal variability of soil fertility indicators and sampling periods in Québec.Canadian Journal of Soil Science 102(2), 549-559.
- Mallarino, A.P., and Oltmans, R.R. 2014. Potassium Management, Soil Testing and Crop Response. North Central Extension-Industry Soil Fertility Conference. 30:45-52.