Resources for Evaluating and Salvaging Moisture Stressed Corn for Corn Silage
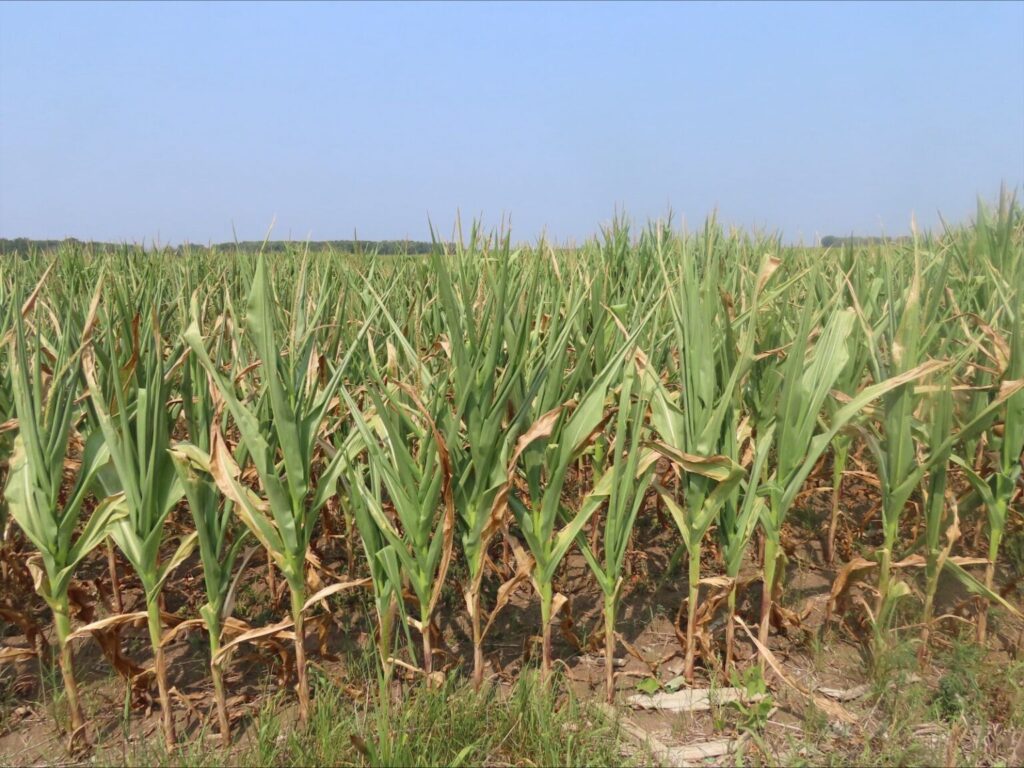
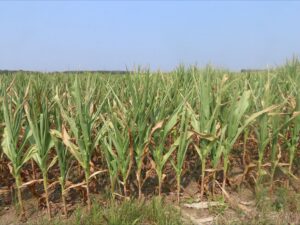
Under exceptionally dry conditions, there can be corn fields which are severely moisture stressed to the point they will make very poor (or in some cases almost zero) grain yield (Fig. 1). Under these same conditions, forage yields on livestock farms may also be suffering and alternative sources of forage may be sought. Whether moisture stressed corn fields were originally intended for corn silage or were grain corn fields that will be salvaged as corn silage, there can be challenges and risks making corn silage under moisture stressed conditions that don’t exist under non-stressed conditions.
The following resources may assist in making decisions and managing risks associated with making corn silage from moisture stressed corn.
- Evaluate for Successful Corn Pollination and Grain Yield Potential
For moisture stressed corn fields originally intended for grain, a very rough yield expectation can provide an indication if the field is still worth keeping for grain, or if the field should be harvested for silage if that opportunity exists.
Poor pollination and kernel set can be a significant cause of yield loss under moisture stressed conditions. The earliest evaluation of pollination success and kernel set can be made as soon as shortly after pollination by doing the silk “shake” test or slightly later by looking for the number of kernels in the “blister” stage. In severe cases, a corn crop may not even reach tasseling or silking stage before succumbing to moisture stress, in which case grain harvest is clearly not an option.
More details around evaluating corn pollination success are available HERE on Field Crop News.
- Check Crop Protection Product Labels
Check the labels of any crop protection products used on the moisture-stressed corn for restrictions or time intervals required before feeding as silage to livestock. Some product labels have very clear guidance around using treated crops for silage or feed. Others may not – this may be a sign that these products do not have research to support these uses. Corn treated with products with no feeding guidance should likely not be harvested as silage. Crop protection labels can be found from crop protection companies or at the Crop Protection Hub. Once a label has been opened, use the “find” function (Ctrl F) to search for keywords around silage or feeding use. Contact crop protection companies for more details around using corn treated with crop protection products for silage or feeding.
- If the Crop is Insured, Contact Agricorp
Before any harvest decisions, a call to Agricorp must be made if the field in question is covered by crop insurance to see how taking the field as silage will impact any potential crop insurance claims. This should be made regardless of whether the field was originally intended for silage or grain.
- Using Moisture Stressed Corn for Silage
If grain yield potential is low and corn silage is being considered, forage testing should be conducted to evaluate the value of the feed and whether it is worth taking as a forage. Total energy levels will likely be low, but also potentially highly variable depending on variability in stress across the field. Feed may only be adequate for animals with low to moderate energy requirements. Harvesting at the correct moisture content will be critical for good fermentation. There is also concern around nitrate levels and silo gas risks of using drought-stressed silage, especially if rainfall is received shortly before silage harvest.
More general considerations and risks around using corn damaged by dry weather for silage are available HERE on Field Crop News.
- Using Moisture Stressed Corn for Feed
During years with significant moisture stress and low forage yields, moisture stressed corn fields can present an opportunity to boost forage supplies. Forage testing is critical when taking moisture stressed corn for feed as there can be significant variability in feed value across or even within fields. Where pollination or grain fill have been compromised due to moisture stress, there is an expectation that energy content will be reduced relative to non-stressed corn silage. Forage testing is also critical for balancing rations when feeding moisture stressed corn silage.
Moisture stressed corn can be harvested by grazing, green chopping or fermenting as corn silage. Strip grazing is critical to limiting livestock to no more than 2 days worth of feed at a time. Green chopping and silage both need to be monitored for nitrate levels – lab testing should be conducted to fully know risks. Green chopping can be riskier for nitrates – silage fermentation can reduce nitrate levels while green chopping does not.
More general considerations and risks around using corn damaged by dry weather for feed are available HERE on Field Crop News.
- Harvesting Corn Silage at the Right Moisture
Harvesting corn silage at the right moisture is critical for good fermentation and feed quality. Moisture stressed corn silage will require even greater vigilance – the corn kernel milk line indicator for when to start monitoring whole-plant moistures may be much more variable or even non-existent in some extreme cases. Firing of lower leaves of moisture stressed corn may also make it look drier than it actually is. Thorough sampling, quick turnaround for analysis and in some cases taking samples to a lab are critical for accurate results.
More details around harvesting corn silage at the right moisture are available HERE on Field Crop News.
- Nitrates in Silage
Nitrates can be a greater risk in moisture stressed corn silage. This is especially true when rainfall is received after an extended period of dry stress which can flush more nitrates from the soil into the plant. Nitrates typically accumulate in the lower part of the stalk. Delaying harvest for a week after rainfall gives time for the plant to reduce nitrate levels. Chopping height may also be a management tool to reduce levels. Testing silage for nitrates is important for livestock health to avoid nitrate poisoning. High nitrate levels also increase risks of silo gas. Proper fermentation (whole plant moisture content, packing) can reduce nitrate levels.
More details around managing nitrates in silage and other livestock feeds are available HERE and HERE on Field Crop News.
- Silo Gases
High nitrate levels in corn silage increase the risk of silo gas (nitrogen dioxide) production. Silo gas risks can be increased when moisture stressed corn is harvested as silage, especially when rainfall is received after a long period of dry stress which can flush more nitrates from the soil into the plant. Delaying harvest for a week after rainfall gives time for the plant to reduce nitrate levels. Testing silage for nitrates is important for both livestock and human safety. Exercise extreme caution around silos for several weeks after filling in dry years.
More details around managing silo gases are available HERE on Field Crop News.
- Pricing Moisture Stressed Corn Silage
Pricing moisture stressed corn silage can be more challenging. Pricing corn silage is usually a negotiation between a buyer and seller that is somewhere above the grain and nutrient removal value of the grain corn and stover being harvested and likely no higher than the cost of buying replacement feed that provides the same feeding values of the corn silage.
Some basic considerations and scenarios around calculating grain and nutrient removal values of normal and stressed corn are available HERE and HERE on Field Crop News.
A spreadsheet which provides some guidance for pricing corn silage is also available HERE on Field Crop News.
OMAFA Weather Summary: Thurs Aug 14—Wed Aug 20 2025
| Location | Highest Temp (°C) | Lowest Temp (°C) | Rain for Week (mm) | Rain Since April 1st (mm) | GDD0C April 1st | GDD5C April 1st | CHU May 1st |
| HARROW | |||||||
| 2025 | 31.0 | 14.2 | 5.6 | 384.9 | 2488 | 1800 | 2660 |
| 2024 | 26.9 | 8.8 | 16.1 | 395.4 | 2595 | 1883 | 2785 |
| 2023 | 24.9 | 10.8 | 68.6 | 450.6 | 2346 | 1652 | 2496 |
| 10 YR Norm (2011-2020) | 26.7 | 15.9 | 29.9 | 439.9 | 2438 | 1730 | 2710 |
| RIDGETOWN | |||||||
| 2025 | 29.4 | 13.2 | 14.1 | 318.7 | 2364 | 1679 | 2489 |
| 2024 | 26.2 | 7.1 | 34.3 | 517.5 | 2454 | 1747 | 2613 |
| 2023 | 25.4 | 8.7 | 28.9 | 459.2 | 2233 | 1548 | 2334 |
| 10 YR Norm (2011-2020) | 26.5 | 13.5 | 14.2 | 396.2 | 2293 | 1591 | 2524 |
| SARNIA | |||||||
| 2025 | 31.7 | 12.8 | 15.3 | 430.5 | 2324 | 1645 | 2415 |
| 2024 | 27.7 | 11.4 | 27.6 | 437.4 | 2448 | 1744 | 2600 |
| 2023 | 26.1 | 10.4 | 54.1 | 393.9 | 2201 | 1517 | 2272 |
| 10 YR Norm (2011-2020) | 27.0 | 15.0 | 24.4 | 401.6 | 2265 | 1565 | 2503 |
| LONDON | |||||||
| 2025 | 32.0 | 12.8 | 13.3 | 318.4 | 2278 | 1614 | 2419 |
| 2024 | 27.2 | 9.3 | 26.6 | 529.4 | 2435 | 1725 | 2609 |
| 2023 | 24.9 | 9.1 | 26.4 | 476.5 | 2216 | 1531 | 2322 |
| 10 YR Norm (2011-2020) | 26.3 | 13.9 | 22.2 | 407.1 | 2274 | 1575 | 2508 |
| BRANTFORD | |||||||
| 2025 | 32.0 | 11.9 | 8.1 | 342.1 | 2310 | 1637 | 2397 |
| 2024 | 27.6 | 8.1 | 15.2 | 452.8 | 2384 | 1678 | 2555 |
| 2023 | 25.8 | 7.9 | 40.7 | 413.2 | 2199 | 1513 | 2297 |
| 10 YR Norm (2011-2020) | 27.5 | 13.3 | 18.3 | 360.3 | 2279 | 1583 | 2486 |
| WELLAND | |||||||
| 2025 | 31.2 | 12.6 | 39.4 | 285.0 | 2363 | 1682 | 2499 |
| 2024 | 28.3 | 11.3 | 48.7 | 453.9 | 2452 | 1743 | 2650 |
| 2023 | 25.7 | 11.4 | 34.2 | 441.8 | 2236 | 1544 | 2349 |
| 10 YR Norm (2011-2020) | 26.6 | 14.3 | 14.2 | 365.5 | 2288 | 1588 | 2528 |
| GODERICH | |||||||
| 2025 | 29.4 | 12.0 | 25.5 | 259.9 | 2181 | 1511 | 2310 |
| 2024 | 25.6 | 7.4 | 30.5 | 322.0 | 2227 | 1528 | 2374 |
| 2023 | 24.1 | 9.1 | 34.0 | 320.6 | 2053 | 1385 | 2141 |
| 10 YR Norm (2011-2020) | 25.2 | 14.0 | 23.6 | 357.6 | 2075 | 1385 | 2296 |
| ELORA | |||||||
| 2025 | 30.2 | 10.8 | 30.6 | 353.8 | 2132 | 1471 | 2243 |
| 2024 | 26.4 | 6.4 | 36.8 | 407.0 | 2211 | 1515 | 2370 |
| 2023 | 24.6 | 7.1 | 20.6 | 390.0 | 2034 | 1365 | 2113 |
| 10 YR Norm (2011-2020) | 25.3 | 11.1 | 24.5 | 405.2 | 2054 | 1368 | 2246 |
| MOUNT FOREST | |||||||
| 2025 | 29.5 | 10.3 | 38.7 | 332.1 | 2138 | 1479 | 2257 |
| 2024 | 26.3 | 8.3 | 31.7 | 382.2 | 2195 | 1503 | 2358 |
| 2023 | 24.7 | 8.2 | 12.1 | 361.8 | 2036 | 1372 | 2126 |
| 10 YR Norm (2011-2020) | 24.9 | 12.5 | 22.3 | 417.1 | 2038 | 1360 | 2254 |
| BARRIE | |||||||
| 2025 | 31.9 | 9.8 | 39.6 | 284.3 | 2144 | 1482 | 2261 |
| 2024 | 27.3 | 8.8 | 3.7 | 516.7 | 2164 | 1471 | 2334 |
| 2023 | 25.6 | 10.6 | 17.8 | 483.7 | 2029 | 1359 | 2121 |
| 10 YR Norm (2011-2020) | 25.6 | 11.0 | 22.8 | 366.0 | 2018 | 1344 | 2222 |
| PETERBOROUGH | |||||||
| 2025 | 31.4 | 9.2 | 48.2 | 304.7 | 2177 | 1506 | 2254 |
| 2024 | 28.4 | 8.2 | 10.0 | 392.4 | 2215 | 1517 | 2345 |
| 2023 | 27.1 | 11.0 | 6.3 | 407.5 | 2083 | 1402 | 2128 |
| 10 YR Norm (2011-2020) | 26.4 | 10.4 | 11.9 | 357.7 | 2087 | 1400 | 2252 |
| KEMPTVILLE | |||||||
| 2025 | 32.1 | 8.5 | 2.6 | 263.5 | 2267 | 1593 | 2368 |
| 2024 | 29.9 | 9.6 | 48.6 | 509.3 | 2343 | 1645 | 2531 |
| 2023 | 27.0 | 13.2 | 7.4 | 478.5 | 2217 | 1540 | 2299 |
| 10 YR Norm (2011-2020) | 27.4 | 13.0 | 25.0 | 393.7 | 2193 | 1509 | 2404 |
| SUDBURY | |||||||
| 2025 | 30.3 | 6.7 | 16.2 | 323.4 | 1906 | 1277 | 2065 |
| 2024 | 29.6 | 8.1 | 24.0 | 463.1 | 2042 | 1374 | 2216 |
| 2023 | 25.7 | 7.3 | 14.4 | 472.8 | 1915 | 1287 | 2028 |
| 10 YR Norm (2011-2020) | 24.4 | 12.5 | 23.2 | 381.0 | 1907 | 1283 | 2149 |
| EARLTON | |||||||
| 2025 | 28.0 | 3.2 | 0.0 | 343.3 | 1838 | 1226 | 1991 |
| 2024 | 31.0 | 6.6 | 3.4 | 371.8 | 2005 | 1344 | 2151 |
| 2023 | 26.4 | 8.5 | 11.8 | 309.8 | 1889 | 1260 | 1993 |
| 10 YR Norm (2011-2020) | 24.4 | 10.0 | 15.7 | 345.0 | 1779 | 1177 | 1998 |
| SAULT STE MARIE | |||||||
| 2025 | 28.6 | 10.8 | 54.1 | 366.7 | 1864 | 1227 | 1978 |
| 2024 | 27.4 | 6.8 | 14.1 | 445.1 | 1897 | 1214 | 1998 |
| 2023 | 26.3 | 5.9 | 32.3 | 326.3 | 1859 | 1228 | 1942 |
| 10 YR Norm (2011-2020) | 26.3 | 10.6 | 27.7 | 380.9 | 1727 | 1103 | 1876 |
| THUNDER BAY | |||||||
| 2025 | 29.7 | 7.3 | 1.7 | 345.1 | 1736 | 1127 | 1908 |
| 2024 | 29.1 | 3.7 | 19.1 | 303.5 | 1804 | 1145 | 1874 |
| 2023 | 27.7 | 6.1 | 7.2 | 241.4 | 1737 | 1130 | 1858 |
| 10 YR Norm (2011-2020) | 25.9 | 9.5 | 18.7 | 354.7 | 1694 | 1080 | 1853 |
| FORT FRANCES | |||||||
| 2025 | 26.8 | 7.5 | 12.6 | 347.1 | 1909 | 1266 | 2064 |
| 2024 | 27.0 | 8.5 | 6.3 | 380.0 | 1858 | 1189 | 1959 |
| 2023 | 29.7 | 5.3 | 1.6 | 291.7 | 1899 | 1285 | 2057 |
| 10 YR Norm (2011-2020) | 26.5 | 9.1 | 21.1 | 358.0 | 1817 | 1186 | 2002 |
This weather summary is compiled by OMAFA using Environment Canada weather station data provided by Agriculture and Agri-Food Canada. Data quality is verified but accuracy is not guaranteed and should be used for general information purposes only. For additional locations and weather analysis, visit the OMAFA Pest and Weather System (PAWS)
One thought on “Crop Report – August 21, 2025”
Comments are closed.