Interpreting Results from the Recorded Sensor Output
It is critical that you understand the limitations of the data and how to use the information. This is especially true if you are trying to decide on equipment modifications, and/or purchase. This data comes from public demonstrations like the Innovative Farmers Association of Ontario (IFAO) Compaction Action Day on September 7, 2017. Please remember that events like this are:
- A demonstration, not rigorous research
- One field, one time, one soil moisture (a snapshot of one scenario)
- 1-3 runs across a series of possibly 4 different sensor installations over 3 days
- Multiple equipment configurations crossing the sensors without a true “check” treatment to ensure sensor quality
- 4 different sensor installations, each giving slightly different values
- Some equipment only crossed one installation, in this case no “repetitions” exist
Given the constraints above, the results are reflective of the relative differences between technologies demonstrated. A range of implement types and equipment technologies were tested, and it is the technology that is important, not the brand of tractor or combine. Any of the configurations of axles, tires, weight, and inflation pressures are adaptable to any make or model. From hay wagons to combines, almost all types of implements were represented and tested.
Compaction is very hard to research, and the dynamics can be hard to understand. Compaction can range from mild to severe and depends on many factors: soil health, soil moisture, crop history, tillage, implement size, weight, configuration, tire (track) choice and inflation pressures all impact the severity of compaction.
The data from Compaction Action is presented in the format outlined in Figure 1. A careful review of Figure 1 will help you understand the data charts on individual equipment items.
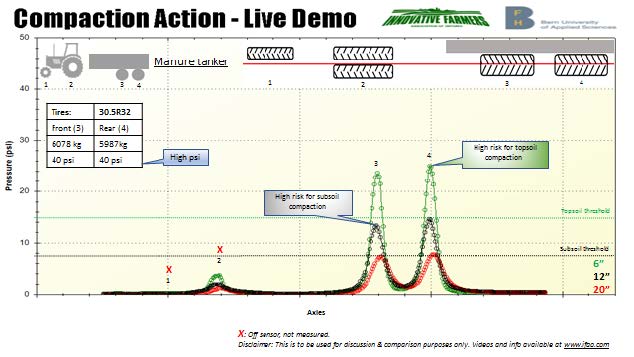
- The “Y” axis shows the pressure in PSI that was detected by the sensors. All charts have the axis as 0-50psi
- The “X” axis shows the configuration of the individual axles that crossed on or near the sensor. Moving from left to right will be the tires/tracks from front to back of the power and pulled unit.
- The table identifies the tire size, weight per tire and tire inflation pressure tested in the current chart (some implements have multiple configurations that were tested and the results appear on separate charts)
- Graphically identifies the implement being tested and identifies the axle number in relation to E and H and I
- Graphically shows the track of the implement across the sensor represented by the red line. Note that in this example the implement was aligned so that the tanker tires crossed over the sensor and that the tractor tires missed the sensor. This is reflected in the chart by the very low “bumps” in the sensor readings for axles 1 and 2 at H
- The Green horizontal line indicates 15PSI. This is the generally accepted level of soil stress at which surface compaction exceeds the threshold for causing yield loss. Based on peculiarities of the software the line colour may vary from chart to chart but its always at 15PSI
- The Black horizontal line indicates 7.5PSI. This is the generally accepted level of soil stress when the threshold for subsoil compaction will be exceeded resulting in potential yield impacts.
- The red “X’s” for axles 1 and 2 for this example in the sensor response indicate that the tires did not cross the sensor either at all or sufficiently to record an accurate measurement as depicted in E.
- The graphical response on the chart indicates the degree of pressure exerted by the tires/tracks which tracked over the sensor. They indicate the maximum pressure exerted. The amount that the stress passes above the threshold horizontal lines indicates the severity of the stress that may result in soil compaction. There are three lines on each chart (line colours may change between charts because of peculiarities of the software) to represent the sensors installed at 6, 12 and 20 inches below the soil surface.
Thus in Figure 1, given the configuration tested (loaded manure tanker, two axles, inflation 40PSI), the stress exceeds the thresholds that would generally lead to compaction at both the surface and subsurface depths.
It is very important to note that the sensors do not measure compaction. They measure the stress on the soil caused by the implement crossing the sensor. The sensors are at 3 different depths to represent the depth to which compaction can potentially occur. The stress is a “proxy” for soil compaction. As discussed previously the amount of actual compaction caused by these stress levels is a function of many factors. It is more realistic to express the compaction threat as a “level of risk”(Table 1). While reviewing the data collected from Compaction Action Day, you can also explore the potential soil compaction that your own equipment may be causing by accessing the www.terranimo.world website developed by Matthias Stettler and his colleagues in Europe. Be sure to click on the small “E” in the top right corner of the homepage to get English translation of the tool.
| Topsoil | Subsoil |
| <15 psi = low risk | <7.5 psi = low risk |
| 15 – 20 psi = medium risk | 7.5 – 15 psi = medium risk |
| 20 – 30 psi = high risk | 15 – 20 psi = high risk |
| 30 – 40 psi = very high risk | 20 – 30 psi = very high risk |
| >40 psi = extremely high risk | >30 psi = extremely high risk |
Table 1. The Risk of Soil Compaction in the Soil Profile at Various Stress Pressures Detected. Stettler et al., 2017.
When looking at the results shown in the charts, it is very important to remember the following:
- The yield loss due to compaction can vary tremendously. The crop grown, site, soil, weather conditions, number of overruns (a single pass being less detrimental than multiple passes) and trafficked area (depending on working width, tire width etc.) all impact the actual outcome.
- The guidelines for yield loss are:
- single severe topsoil compaction: up to 15% for 1 to 3 years
- repeated severe topsoil compaction: 20% (permanent if management remains unchanged)
- repeated minor topsoil compaction: additive over time, up to 15% after several years (permanently if management remains unchanged)
- single severe subsoil compaction: 3% (may be permanent)
- repeated severe subsoil compaction: 5% (likely to be permanent
- Many other soil problems are also caused by compaction:
- increased erosion
- reduced fertilizer efficiency
- lower biological activity (leading to higher efforts for tillage)
- increased movement of nutrients and pesticides (due to damaged micropores) etc.
Take Home Messages:
- The data is based on measurements taken over potentially 3 days, 4 sensor installations, one soil condition (silt loam) on a field with a moist soil profile. (A snapshot in time)
- The number of times that individual equipment was run over the sensors ranged from 1 – 3 times over the 3 days.
- 15 to 20 pieces of equipment were tested over each of the four sensor installations. Soil compression and rutting would lead to some variation, and must be considered in interpreting the results. Every effort was taken to limit this impact, but it cannot be totally avoided. The results are real data points, collected as carefully as possible, but in a demonstration fashion, and not following rigid research methodology.
- Results should be compared relative to each other, not definitively based on the actual numbers. The actual numbers are only a guide, as these would vary from site to site and condition to condition.
- Growers should look for technologies and configurations that lower the numbers relative to the “before scenario”. Implementing these options will lower the potential for compaction and its impact.
- Compaction action was a demonstration day to explore differences in technologies and configurations. Use the results to help improve equipment and management decisions for better crop production and reduced environmental impacts.
- The data is not absolute! It must be interpreted as relative differences of the presented technologies on that given day.
- The higher the wheel load and the higher the inflation pressure, the higher the soil stress/compaction risk.
- Inflation pressure has a huge effect on the stress in the topsoil, but is of minor importance for deep subsoil layers (>15”)
- Very high wheel loads with big footprints lead to deep soil stress, causing compaction risk in the subsoil
- For additional help in making equipment decisions, the use of models based on scientific data is recommended (e.g. www.terranimo.world).