
Sulphur (S) deficiency was very prevalent in winter wheat last spring, including fields with a history of manure applications (Photo 1). The deficiency seen in many fields may have resulted from a cooler than normal April reducing S mineralization.
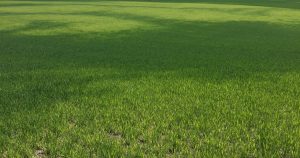
S applications may not be required every year due to the year to year variation in response which might have you asking the question, why bother with S applications? Well, historically S deficiency in winter wheat was not an issue; however, since sulphur oxide emissions have decreased significantly, there is a need to ensure the crop has an adequate supply of S.
Ontario research has shown there is a variation in yield responses to S applications depending on the year. Years with cool, damp spring conditions showed more of a yield response (Table 1). Interestingly, when the data was analyzed further and separated into responsive and non-responsive sites, yield gains were even more significant on responsive fields (Table 2).
Table 1: Average yield data (bu/ac) of 40 locations across southwestern Ontario (Johnson and McClure 2011-2014).
| Treatment | 2011 | 2012 | 2013 | 2014 | Average |
|---|---|---|---|---|---|
| Check (No Sulphur) | 95.2 | 101.4 | 80.2 | 91.6 | 91.0 |
| 5 lbs Sulphur | - | 100.9 | 80.2 | 96.2 | 91.7 |
| 10 lbs Sulphur | - | 102.6 | 81.2 | 96.3 | 92.7 |
| 20 lbs Sulphur | 99.7 | 102.0 | 81.5 | 95.9 | 92.6 |
| 40 lbs Sulphur | - | 102.2 | - | 95.7 | - |
Table 2: Yield Response, 12 responsive sites (Johnson and McClure 2011-2014).
| Treatment | Yield (bu/ac) | Gain |
|---|---|---|
| Check (No Sulphur) | 90.3 | - |
| 5 lbs Sulphur | 93.1 | 2.8 |
| 10 lbs Sulphur | 94.6 | 4.4 |
| 20 lbs Sulphur | 95.2 | 5.0 |
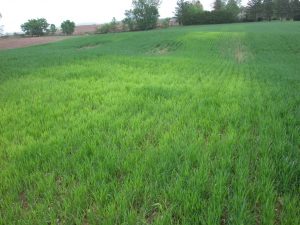
So, as we start thinking about fertility management this spring, don’t forget about sulphur. Pay close attention to the temperature and if the weather continues cool into the spring as wheat advances an application of S may be needed. Get out and walk your fields and if you are seeing deficiency symptoms (Photo 2) consider a tissue analysis to confirm. Ontario research suggests yield responses for S applications when tissue-S concentrations are below 0.25, while tissue-S concentrations above 0.30 rarely show a response.
Although a tissue test will assist in determining whether you have S deficiency, it may not be as helpful in determining the optimal rate to apply. Ontario research suggests that the optimal rate is 10 lbs/ac. However, some fields may require a higher rate so do some test strips in your fields to compare yields and identify responsive and unresponsive fields. If you are seeing a deficiency, apply S as soon as possible. Once an application of S has been made a response is typically seen in 3-4 days, but as we saw this past season it can take up to 10-14 days.