
Co-author Ken Janovicek, University of Guelph.
Background
The OMAFRA field crop unit in collaboration with farm cooperators, agribusiness and SGS-AgriFood Labs conducted the annual survey of soil nitrate nitrogen levels across the province from June 3rd to June 5th, sampling over 130 fields. The samples were collected after heavy rainfall events during the weekend of May 30-31, where some areas received up to 10 cm (4″) although amounts varied widely. Rainfall events are known to reduce soil N levels due to leaching or denitrification. Delaying sampling a few days after significant rains is always advised but sometimes impossible based on corn stage etc.
Results
Soil nitrate levels in 2015 survey fields were considerably higher when compared to the OMAFRA soil Nitrate Nitrogen surveys from previous years (Figure 1).
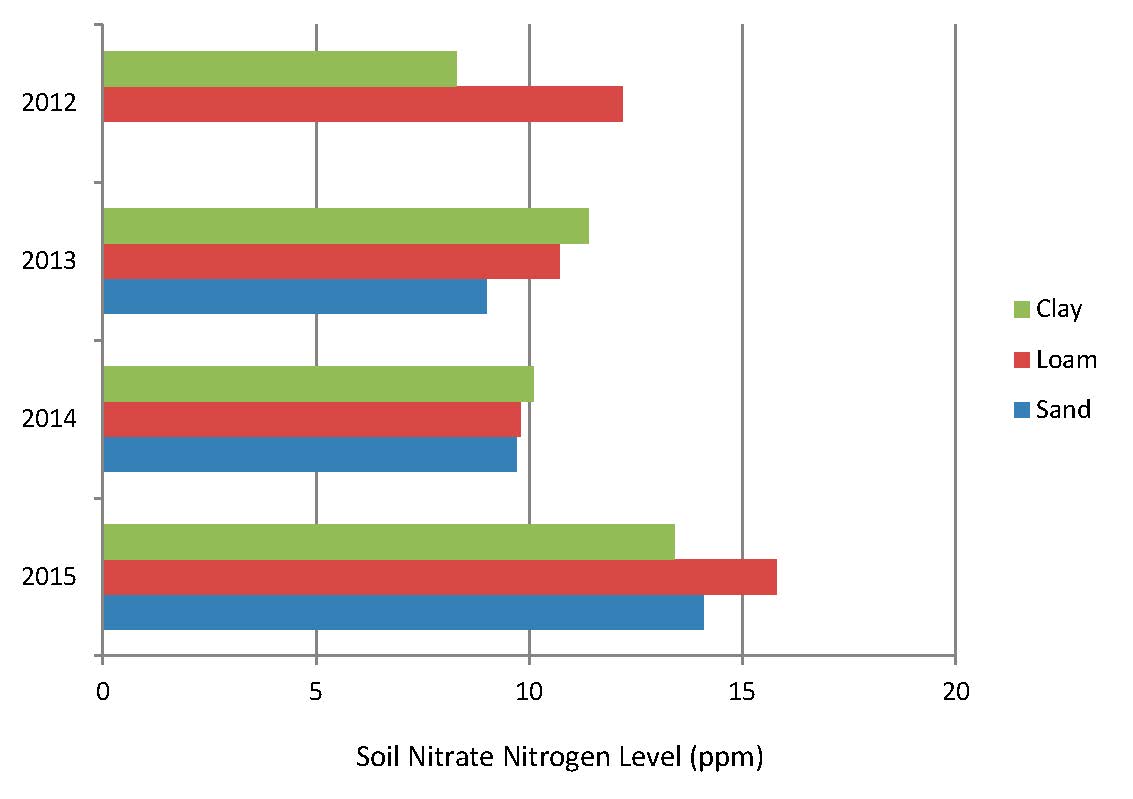
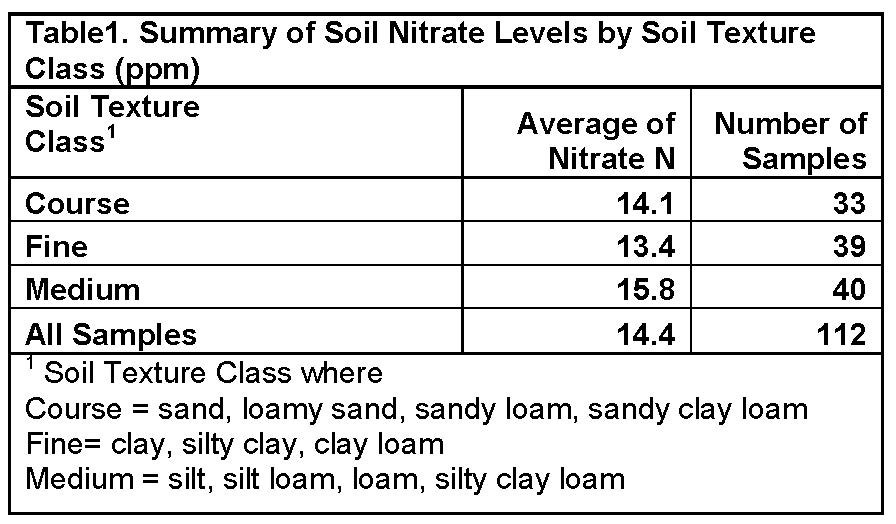
The 2015 soil N survey targeted fields where N containing fertilizer was not broadcast applied this spring, had no recent history of manure and the previous year crop was corn, soybeans, edible beans or cereals. Medium textured soils (loam, silt loam and sandy clay loam) had soil nitrate levels that averaged 15.8 PPM (Table 1), which was 4-5 ppm higher than the surveys historic average of 11.0 PPM. Survey average nitrate levels for recent years on medium textured soils were 9.8 ppm in 2014 (wet May), 10.7 ppm in 2013 (cool wet spring), 12.2 PPM in 2012 (warm spring) and 9.5 PPM in 2011 (cool spring). Mineralization of organic nitrogen is influenced by temperature, precipitation, time and field history. Drier than normal spring conditions reduce the amount of N loss due to leaching or denitrification and probably explains the relatively high early June soil nitrate levels observed in the 2015 survey.
Spring nitrate levels in 2015 do not appear to be significantly affected by soil texture. Historically, soil nitrate levels have been lower on clay and sandy textured soils when compared to loam and silt loam soils. Sandy and clay soils are more sensitive to heavy rainfall in terms of nitrate loss (through leaching and denitrification respectively) and the dry spring conditions in 2015 minimized risk of N loss through these processes.
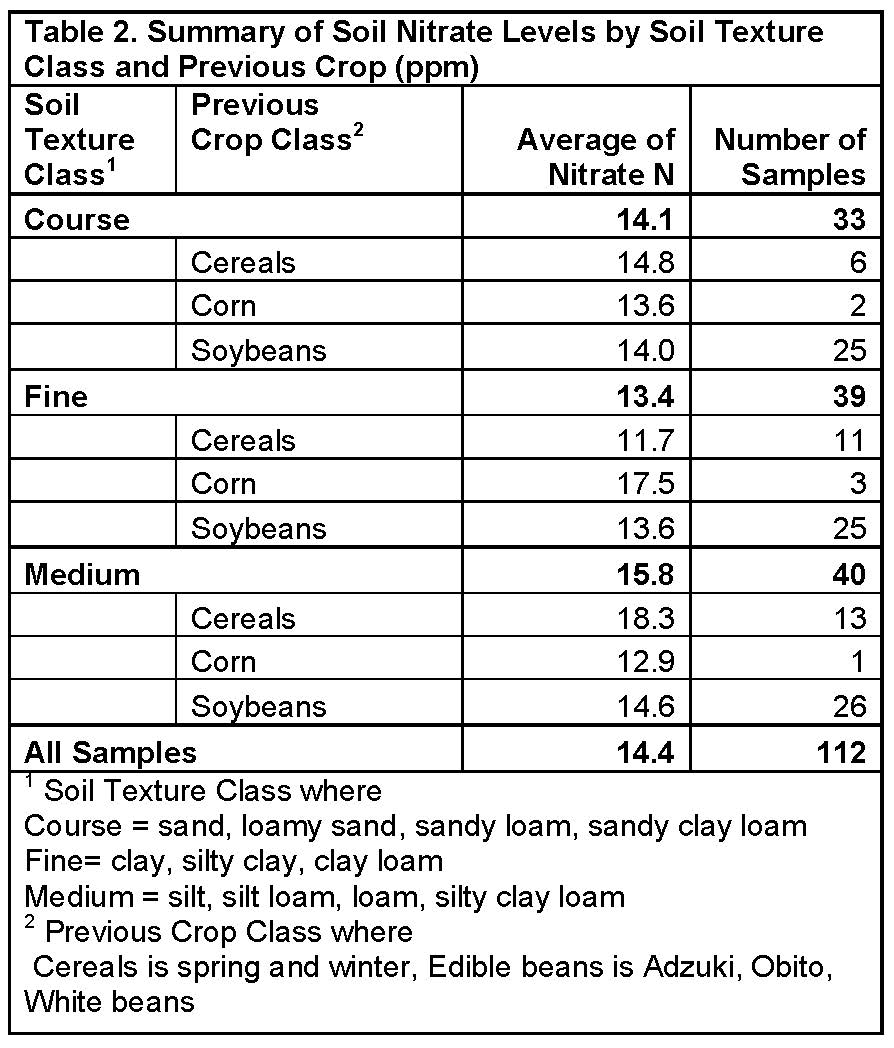
Previous crops (cereals vs. soybeans) usually had small effects on average soil nitrate levels observed in 2015 (Table 2). Where corn was the previous crop, sample numbers were small so an individual sample with high level can impact the average substantially.
On the medium and coarse soils nitrate levels averaged lower in no-till fields (Table 3). Tillage accelerates the rate of N release from organic matter and this process probably accounts for higher soil nitrate levels observed in mulch-till and conventional-till fields (Table 3).

Recommendations
The higher than usual average soil nitrate levels observed in this year’s survey suggests that fertilizer N requirements in 2015 may be less than the rates generally needed in most years. To confirm fertilizer N requirements for individual corn fields producers should be using a PSNT test on their fields to determine the adjustment amount of fertilizer nitrogen required compared to normal rates of nitrogen that they typically apply at side dress or with late applications (See Table 5). Where nitrogen has previously been applied and following some significant rain amounts, the high level of mineralization in 2015 suggests that sufficient nitrogen should be available to finish the crop.
A 1PPM change in PSNT test level suggests a change in recommendation of about 10 lbsN/ac. If the traditional average PPM level of soil nitrate for early June timing is 11.0 ppm, then normal rates of fertilizer nitrogen might be 40-50 lbsN/ac less this year because of higher than normal soil nitrate availability observed in many survey fields in 2015. This however, cannot be determined without taking a PSNT soil sample yourself.
Remember that soil nitrogen tests are based on a well-mixed composite of multiple 30cm/12inch cores collected across the field. Samples must be quickly cooled and kept cool in transport to the labs for rapid and accurate analysis.
A PSNT test taken in early June having a test value over 25ppm indicates that there is probably sufficient soil nitrogen supply to meet corn nitrogen requirements.
A PSNT test taken in early June having a test value over 25ppm indicates that there is probably sufficient soil nitrogen supply to meet corn nitrogen requirements. However, a change in the PSNT table to include “yield goal” as a parameter in the recommendation shows that the amount of nitrogen needed above 25ppm will occur under higher yield expectations (Table 4.)
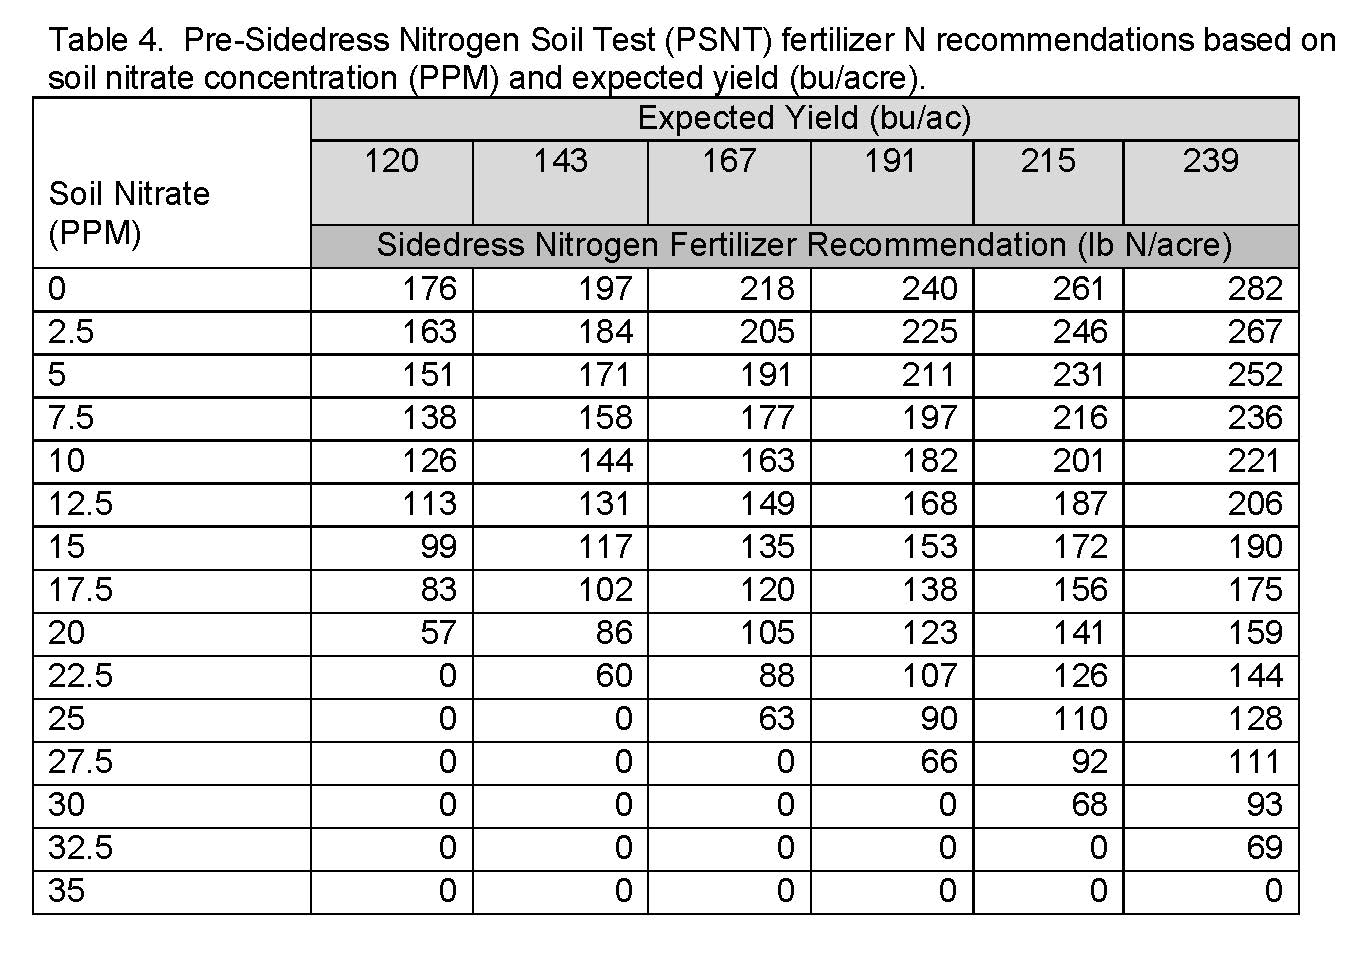 The Nitrogen rates in Table 4 represent the total amount of Nitrogen recommended. Side dress rates applied should subtract the starter nitrogen rate already applied from the above table rates to determine the actual amount to apply as a side dress or in-crop broadcast application. The yield projections chosen must be “proven yields” that have occurred on the farm. Further research is needed to understand the amount of nitrogen made available to the crop from in-crop late spring applications of broadcast nitrogen (urea, dropped piped UAN, etc). The table values above are calibrated based on an injected side dress application method.
Where preplant nitrogen was previously broadcast to the field before soil sampling, this table does not offer reliable nitrogen recommendations.
Past Soil N Surveys