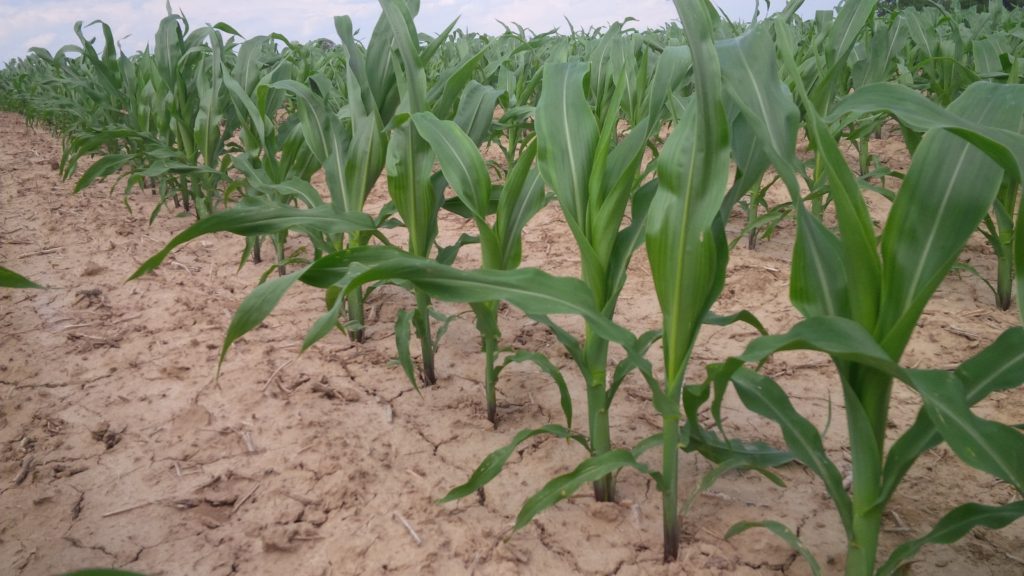
Past research in Ontario and abroad has demonstrated the importance of uniform emergence for maximizing corn yield. At the Southwest Ag Conference in January, Randy Dowdy, 2014 National Corn Growers Association yield contest winner from Georgia proposed the “flag test” – returning to a plot every 12 or 24 hours and flagging every newly emerged plant using a different coloured flag for each visit as a simple means of assessing emergence variability on your farm. Comparing flag tests for different practices within the same field (cover crops, tillage) may also demonstrate how practices influence variability. Several growers and industry personnel have been conducting their own flag tests in 2016.
If you have not conducted a flag test, but are interested in evaluating plant variability in your field, it is not too late. Dr. Dave Hooker at the University of Guelph, Ridgetown Campus has developed a protocol to measure variability during leaf stages. The protocol provides measurement guidelines to make data collection across locations as consistent as possible and is outlined below. A spreadsheet for recording data is available here: PPV Study – Data Recording.

PROTOCOL:
Plant-plant Variability Study in 2016
Recent studies have indicated that plant-to-plant variability (PPV) in crop development reduces grain yield. We are now into June; it is obviously too late to formally organize experimental designs for each field (perhaps in 2017). It is not too late, however, to organize a protocol for collecting data from multiple field locations that have been setup for studying PPV.
Quantifying the impact of PPV on grain yield would prioritize efforts to identify the factors associated with PPV. Variability may be introduced into corn plant stands by emergence timing differences (Bos, 2014), spatial differences in soil characteristics, spatial differences in parasites and pathogens, plant competition and interference (Wu, 1998), plant spacing (Liu et al. 2004) and plant density (Vyn, 1978).
Research Questions:
- What is the impact of PPV on grain corn yield across multiple environments?
- How do various production practices (e.g., tillage systems, seed treatments, cover crops, etc.) affect PPV?
Objective: to further quantify the impact of PPV on grain corn yield as affected by various agronomic practices.
Protocol: growers and researchers are invited to participate in the study by recording data on a per-plant basis from within row segments of various agronomic practices in the same field. In 2016, we understand that every PPV study will consist of different treatments and a range of row segments and replications. However, a standardized measurement protocol and data collection would facilitate data analysis and strengthen conclusions.
If you are interested in participating in this study:
- Please contact Dave Hooker (dhooker@uoguelph.ca).
- Download the spreadsheet for data entry. Tailor the data entry sheet based on your field study. An example field study is provided in the spreadsheet. Dave Hooker will provide assistance. Briefly, every plant in all row segments of the study will be tagged with a unique code. This code will be based on the replication number, treatment number (e.g., cover crop tmts, tillage system tmts, seed tmts, etc.), planter row number, and the plant number in the row segment).
- It is obviously too late to record corn emergence timing data; however, it is not too late to setup a study to observe developmental differences and PPV (start with leaf number measurements instead of emergence timings).
- The full measurement protocol is as follows (see also the spreadsheet for further clarification):
- Be sure to setup the data entry sheet correctly (see point 2 above).
- Measure the length of each row segment (column “I” in the data worksheet).
- Estimate the distance between plants (within an inch) and record in column J in the data worksheet. The first number (see 15 cm in the “data example” worksheet) is the estimated distance from plant 1 and 2 in the row segment). These estimates do not have to be precise – just eyeball the plant spacing.
- Label the plants. This is critical for good data. Each plant needs to be tagged with a plant code (see spreadsheet “data example” for explanation of codes). Tags are available – write or print the code on the tag, and tag the plants when recording leaf numbers (at approx. 8-11 leaf tips). Be sure to place the tag high on the plant to avoid soil splash.
- Record emergence date for each plant (if data are available).
- Count leaf tips for each plant when most plants have between 8-11 leaf tips visible.
- Record the day of silking. Silking occurs when the first silk appears.
- Optional. Record the day of pollen release. This occurs when the first pollen is released.
- Ear harvest. Harvest the ear (or ears) and place in a mesh bag along with the tag with the plant code. If there are 450 tagged plants in the study, you should have 450 mesh bags. Mesh bags from plants barren of ears will only have the tag. The bags and ears should be dried ASAP until constant weight, then each ear shelled and weighed. The weigh scale should read to the gram. Record the weight in the spreadsheet.
