
By Joey Sabljic
Precision Agriculture Advancement for Ontario: This article is part of a series dedicated to helping farmers understand and implement precision agriculture technology. It is based on research conducted by Nicole Rabe, Ian McDonald, and Ben Rosser at OMAFRA, in conjunction with Mike Duncan, Sarah Lepp, and Gregor MacLean at Niagara College.
EVERY SINGLE FIELD has its own story to tell.
And this story can be about the highly productive, organic matter-rich areas that supply high yields — and the droughty knolls that perform poorly every season.
Knowing the full story of a field can help growers adopt a precision agriculture approach and tailor their inputs to benefit their land, boost profitability and reduce their overall environmental impact.
But what kind of information or data do growers need to find out exactly what that story is? This is one of the big questions that the research team behind the Precision Agriculture Advancement in Ontario (PAAO) project is trying to answer.
According to Nicole Rabe, a Land Resource Specialist with the Ontario Ministry of Food, Agriculture and Rural Affairs, a lot of the data growers need might already be sitting on their farm computers just waiting to be tapped.
MANAGEMENT DECISIONS
Before diving in, Rabe says growers first need to ensure they’re making good management decisions across their fields — such as tile drainage, crop rotation, and soil testing — and that they’re correcting the most obvious agronomic issues.
“Every high-yielding and every low-yielding area in your field isn’t necessarily performing poorly or better for the same reasons,” she explains. “There are a whole bunch of measurements you need to do, such as soil sampling, texture analysis, and identifying insect damage and disease.”
Once those agronomic issues are addressed, the second step is for growers to collect and save high quality yield data over several seasons.
Rabe says that yield data collection can be a big challenge, as the information coming in from the combine isn’t always being properly collected, stored or mapped consistently. This can be due to several reasons — from a hard drive crash or GPS malfunction, to fields being cropped differently.
“When you don’t have multiple years of good, consistently mapped-out yield data, it’s really difficult to pinpoint the parts of your field where you’ve had a lot of success, or where you’ve struggled each season,” explains Rabe.
Another obstacle is that many growers will use custom combiners to harvest their crops and don’t know to ask for their yield data.
“The key — especially if you don’t own precision equipment — could be to have a conversation with your custom app guy and capitalize on the specialized equipment they’re using by asking for your yield data back,” says Rabe.
She points out that being able to create reliable and consistent management zones in a field works best when working with the yield numbers for a single crop type.
Growers should aim to gather three years each of corn, soybean or wheat data. In a two-crop rotation, it can take six years to gather three consistent years of corn data, or nine years in a three-crop rotation.
YIELD RESPONSES
However, in looking at several years of grower-supplied yield data, a Niagara College research team found that corn and wheat yield responses are similar across a field’s soil landscape. This means that corn and wheat yield numbers could be blended together to provide multi-year data.
The researchers found that soybean yield responses, on the other hand, where quite different and shouldn’t be factored in to a multi-year map.
Rabe emphasizes that, while having yield data helps tell part of a field’s story, it doesn’t fully explain the “why” behind higher and lower-yielding areas. To answer those questions, growers should look further beyond their yield data. Though, the good news is that they may already have the tools needed to collect more detailed landscape information.
Real Time Kinematic (RTK) GPS guidance systems are able to generate elevation data, another important part of finding out a field’s full story.
By looking at the yield and elevation data together, growers can get a better understanding of the field’s topography — such as highly-eroded knoll areas — or lower-lying parts of the field that tend to have higher organic matter, deeper topsoil and – depending on the season — hold water for too long.
“When you get into other data layers, like elevation, you should start to see that connection between your yield information and the different physical features of your fields,” says Rabe. “Working with these multiple layers can help you distinguish between how the crop normally responds to the static features of the landscape versus what can be further tested and managed.”
But even with yield and elevation data under their belts, Rabe stresses that growers need to make sure they go in at field level, work with their trusted crop advisors and confirm that what the numbers are telling them is actually true.
“These data layers are another wrench in your toolbox,” she says. “They just take you and your agronomist to these trouble spots in your fields and measure the impact.”
After collecting yield and elevation data and then scouting at the field level, growers can start mapping out management zones based on what they can see as the highest, lowest and inconsistently performing areas of their fields.
Rabe says that growers that are unfamiliar or uncomfortable with the software programs used to perform this management zone mapping should seek out in-person or online training, or work with an agronomist that can help them bring each data layer together into a useable map.
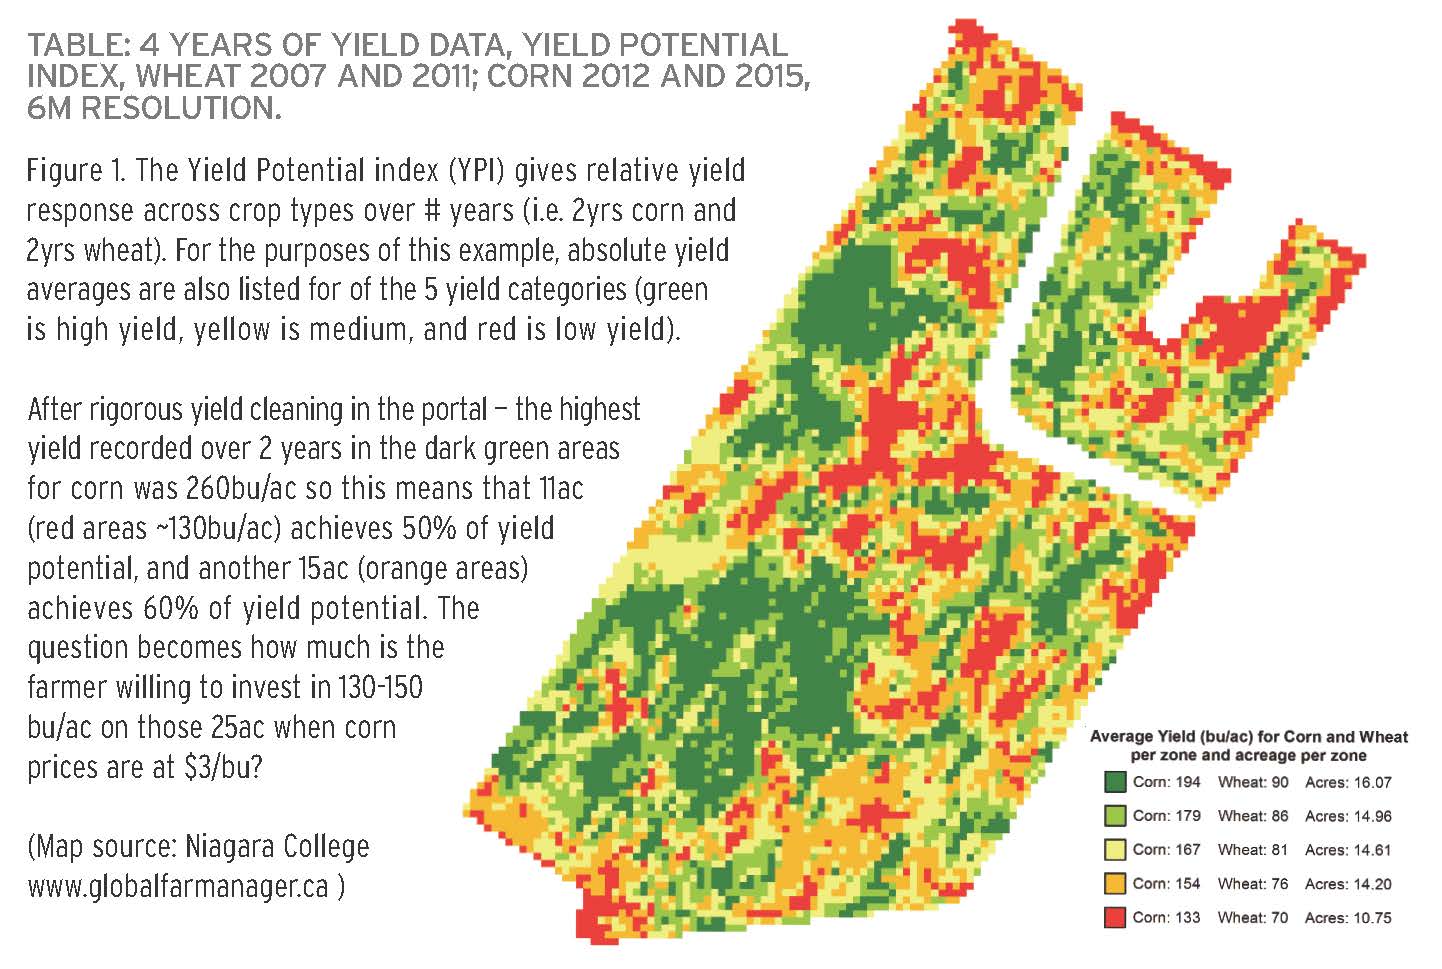
With the management zone mapping in place, growers can start looking at the amount of yield variability across their field and start asking tougher questions – namely, are there certain management zones that are even worth the additional investment in inputs and management? (Figure 1)
‘“If you’re looking at your yield maps and there are areas of the field that are consistently low yielding year in and year out with little hope of a straightforward agronomic fix, then you need to sit back and think critically about what you’re investing in seed and fertilizer and whether that makes sense,” says Rabe.
“We have the tools that can help you invest in the parts of your field that are profitable and move away from the areas where you might be losing inputs that may result in higher environmental risk off-site and off the farm.” •
For more on precision agriculture go to: www.gfo.ca/Research/Understanding-Precision-Ag