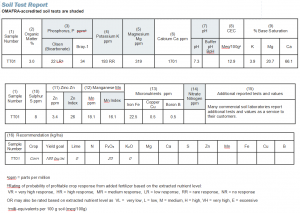
Regular soil testing is a critical component of good crop production. It allows you to monitor soil fertility levels, identify potential for nutrient deficiencies, and make fertilizer decisions based on the best possible information. Perhaps you had samples taken this fall and sent off, and have received the soil test report back (see Figure 1 for an example). Whether you opted for grid sampling, zone sampling, or just a regular composite sample, it can sometimes be a challenge to understand exactly what those numbers mean and how to use them to make decisions. Also, if you’ve been given a fertilizer recommendation, it is useful to be able to double check to make sure it’s in the right range.
Making sense of the numbers
When a soil sample is submitted to the lab, it is dried and ground and a variety of extractions are performed on small “sub-samples”. It’s important to bear in mind that these sub-samples may be as little as 2 grams of soil, so it is critical to obtain as representative a sample as possible. The extractants pull the easily and some of the moderately available nutrient from the soil. The soil test value for a given nutrient does not give you the total amount of that nutrient in the soil; it instead provides an index of nutrient availability that is correlated with plant response. For the base cations (potassium, calcium, magnesium), the value represents the “exchangeable” form of the nutrient – the portion that is attached to clays and organic matter and available to move into soil solution.
Soil test values are reported in parts per million (ppm), which represents 1 milligram of extracted nutrient for each kilogram of soil. If you want to estimate the value in pounds per acre, you can simply multiply the ppm value by two to obtain pounds per acre. For example, a potassium soil test value of 193 ppm equates to 386 lbs/acre (of “exchangeable K” in the top six inches of soil).
Pay attention to the extractant used for your soil test. For example, the Olsen (or sodium bicarbonate) extraction is the OMAFRA-accredited test for phosphorus. OMAFRA fertilizer guidelines are based on the Olsen test. Be sure that you are not accidently confusing a Bray-1 P soil test result with an Olsen result. Depending on the lab you use, each OMAFRA-accredited test value should also have a code associated with it. The code will give you a sense of how likely you are to have a profitable response to an application of that particular nutrient (e.g. LR means that there is a low likelihood of response to that nutrient, since the background level is relatively high).
In terms of which values to focus on, soil pH should always be a starting point. Refer to pg. 221 of the most recent Publication 811 to determine when lime is recommended. Percent organic matter is another critical measurement – monitoring its value over time can tell you quite a bit about how well your soil management practices are working to maintain or build it. Macronutrients, in particular phosphorus and potassium, should be the next area of focus.
Fertility guidelines
OMAFRA fertilizer guidelines, which can be found in Publication 811, are based on the sufficiency approach, which provides the greatest potential economic response in a given year based on crop and soil test level. Depending on your situation, you may want to invest in raising soil test levels for phosphorus or potassium. A recent review of decades’ worth of Ontario research showed that when phosphorus is within the range of 12-18 ppm (Olsen), starter fertilizer rates (i.e. 20-30 lbs P2O5/acre) achieved the most economic response for phosphorus. The same was true for potassium when levels were between 100-130 ppm.
It is generally assumed that the following amounts are required (above crop removal) to move soil test values up by 1 ppm:
- 35 lbs/acre P2O5 and 20 lbs/acre K2O
These values are guidelines and can vary depending on a variety of factors, including soil type. In some situations, the amount of nutrient required to raise soil test values may be lower. If you had a field sitting at 10 ppm P and 80 ppm K, P and K above crop removal could be applied over a number of years to reach targets of 15 ppm soil test P and 115 ppm exchangeable K. Variable rate technology is available to apply these nutrients according to where they are needed on the field.
It is important to bear in mind that nutrients behave differently in soil. Because of how reactive phosphorus is in the soil, as much P as possible should be banded to provide optimal benefit to the crop in the growing year. If phosphorus is broadcasted, it should be done so during a time period when risk of soil and nutrient loss due to runoff is low (e.g. late summer after wheat harvest).
Consider alternative nutrient sources as well if they are available in your area. Sources such as municipal compost, processed biosolids products, and manure (if available), can be used to address fertility levels and have the added benefit of contributing to soil organic matter and improving soil structure over the long-term.