
Sulphur (S) had been a neglected nutrient in Ontario for many years. For decades, in much of Ontario, sulphur came in significant quantities from the sky – deposited from emissions from industrial activity. Even before that, impurities in fertilizers and more widespread application of manure helped ensure a regular addition of sulphur to our soils.
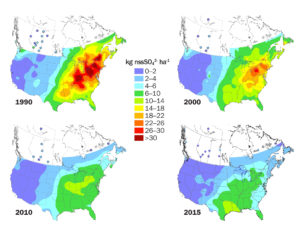
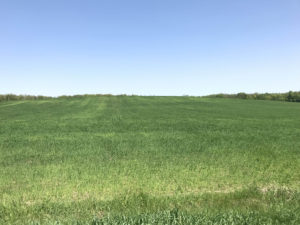
In recent years things have changed. Monoammonium phosphate (MAP) replaced sulphur-containing superphosphate fertilizer decades ago. As of 2016, only 20% of fields in Ontario received manure. More importantly, atmospheric sulphur deposition has declined rapidly due to stricter emissions regulations. Sulphur deposition in parts of southern Ontario has dropped from close to 40 lbs/acre of sulphate-sulphur annually in 1990 to as little as 5 lbs/acre per year in 2015 (Figure 1). This trend, combined with higher yields and demand for sulphur, has resulted in more frequent incidents of sulphur deficiencies in Ontario (Figure 2).
Sulphur in plants and soil
Sulphur plays an important role in the growth and development of all crops. It is needed for two of the amino acids that make up protein. It’s also essential for the creation of chlorophyll and in activating certain enzymes.
Similar to nitrogen, most sulphur in soil is stored in organic matter. As organic matter is broken down, a portion of the sulphur is transformed to sulphate, the form of sulphur that is available for root uptake. Its availability is determined by the rate of mineralization and it can be lost to leaching below the root zone. Typically, only 1 to 5% of the organic sulphur in soil is converted to sulphate over a growing season.
Sulphur uptake: quantity and timing
Sulphur demand varies by crop. Alfalfa has the highest demand of all field crops. A 6 ton/acre harvest removes over 30 lbs/acre of S. Winter wheat removes 1 lb/acre for every 10 bushels of grain, while a 185 bu/acre corn crop takes up close to 27 lbs S/acre over a season and removes 15.
Timing of sulphate availability is also important. Because winter wheat matures earlier in the season than spring-seeded crops, its demand for S occurs more quickly. The same is true for first-cut alfalfa. In a very wet and cool spring, for example, the conversion of organic S to sulphate may be delayed.
Impact of soil type
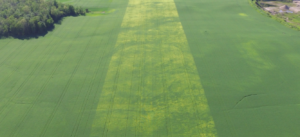
Because soil organic matter is the main source of sulphur, sandy soils and eroded knolls low in organic matter are most likely to show S deficiency. Soils with coarse subsoil may also be more at risk, since leaching of sulphate is more likely. In Figure 3, winter wheat in a loamy sand soil shows sulphur deficiency in a non-fertilized strip. The reported yield loss was 16 bushels/acre.
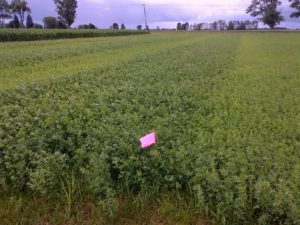
While S deficiencies are most likely on light-textured soils, symptoms are becoming more common on heavier soil types (Figure 4). The likelihood of observing a deficiency is determined by a combination of crop type, crop demand for S, soil texture and organic matter levels and field history (e.g. past applications of organic materials such as manure).
Diagnostics
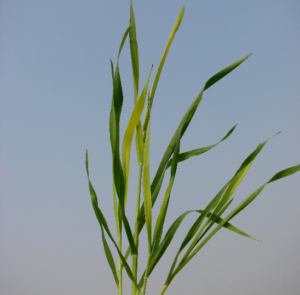
Sulphur deficiency symptoms vary by crop. In wheat, S deficiency shows up first as yellowing or chlorosis of the younger leaves (Figure 5). As the deficiency worsens, the whole plant yellows. Symptoms are similar in corn, though in some cases can be expressed as chlorosis between dark veins. In alfalfa, S deficient plants are spindly and are a uniform light green or yellowish.
Since sulphur deficiencies are a relatively new issue, there has not been a large amount of regional research done on it in the past. Ontario does not have a reliable soil test for sulphur. While many labs provide a sulphur soil test option, it cannot be used to determine a fertilizer rate. Tissue testing is a good option if sulphur may be an issue. For wheat or alfalfa, the nutrient is likely deficient when the %S is below 0.25%.
Guidelines for Ontario field crops
The most recent Ontario research suggests that 10 lbs of sulphur/acre is the optimal rate for winter wheat, though there are parts of the province that do not require additional sulphur and those that likely require higher rates. In corn and soybeans, there have been isolated instances of S deficiency to date, largely in light-textured soil. A number of on-farm trials are underway this season to evaluate response to sulphur on all three crops across a range of soils.
For those with alfalfa, watch for the symptoms of sulphur deficiency. Although official recommendations do not yet exist, even regular manure applications are no longer a guarantee of adequate sulphur supply.
Sulphur sources
Sources of sulphur include ammonium sulfate, elemental sulphur, sul-po-mag (or Kmag), sulphate of potash and gypsum, as well as liquid ammonium thiosulfate. Ammonium sulphate is immediately available, whereas ammonium thiosulfate requires some time for conversion in the soil. Elemental sulphur is a slow release form that is best applied the fall before and has been used successfully in Ontario to fertilize alfalfa.
Conclusions
Sulphur is a nutrient that now demands our attention in field crop production, particularly for cereals and alfalfa. With good knowledge of field history, soil type and crop demand, we can identify and manage fields that are most at risk of sulphur limitation.
June 13-19, 2018 Weather data
| Weather Summary | ||||||||||
| Location | June 13 – 19, 2018 | Temperature (ºC) | Rainfall | Heat Units | Total Since May 1 | |||||
| Max | Min | (mm) | CHU | Rain | CHU | |||||
| Outdoor Farm Show | 2018 | 26.9 | 13.6 | 11.8 | 144.9 | 88.8 | 956.2 | |||
| 30 Yr. Avg. | 24.4 | 13.1 | 20.4 | 138.2 | 133.8 | 820.7 | ||||
| Windsor | 2018 | 29.7 | 18.1 | 20.6 | 169.0 | 144.0 | 1046.8 | |||
| 30 Yr. Avg. | 25.6 | 14.2 | 19.7 | 147.6 | 123.3 | 919.7 | ||||
| Trenton | 2018 | 25.5 | 13.0 | 12.2 | 138.3 | 128.8 | 930.0 | |||
| 30 Yr. Avg. | 23.6 | 12.5 | 18.3 | 133.3 | 127.9 | 769.8 | ||||
| Mount Forest | 2018 | 26.0 | 12.8 | 2.5 | 136.7 | 59.8 | 921.7 | |||
| 30 Yr. Avg. | 23.2 | 11.9 | 19.1 | 128.0 | 134.2 | 733.8 | ||||
| London | 2018 | 27.9 | 12.9 | 6.2 | 142.0 | 80.2 | 966.4 | |||
| 30 Yr. Avg. | 24.5 | 13.2 | 20.8 | 139.4 | 135.2 | 832.7 | ||||
| Hamilton | 2018 | 28.3 | 13.9 | 40.6 | 145.8 | 104.0 | 972.7 | |||
| 30 Yr. Avg. | 24.4 | 13.3 | 18.2 | 139.5 | 123.6 | 820.0 | ||||
| Ottawa | 2018 | 25.8 | 13.6 | 8.4 | 140.0 | 61.6 | 905.0 | |||
| 30 Yr. Avg. | 24.4 | 13.1 | 22.2 | 139.2 | 136.2 | 823.9 | ||||
| Elora | 2018 | 26.6 | 13.2 | 1.6 | 140.0 | 64.5 | 920.7 | |||
| 30 Yr. Avg. | 23.7 | 12.3 | 18.2 | 131.9 | 130.2 | 766.9 | ||||
| Peterborough | 2018 | 27.3 | 12.0 | 25.6 | 159.4 | 104.0 | 910.6 | |||
| 30 Yr. Avg. | 23.6 | 12.1 | 17.4 | 130.7 | 128.0 | 758.4 | ||||
| Thunder Bay | 2018 | 23.8 | 10.0 | 33.4 | 136.1 | 96.2 | 636.9 | |||
| 30 Yr. Avg. | 21.7 | 8.8 | 18.4 | 123.8 | 124.0 | 584.8 | ||||
| New Liskeard | 2018 | 24.2 | 11.4 | 38.5 | 148.1 | 144.6 | 692.2 | |||
| 30 Yr. Avg. | 22.8 | 9.7 | 18.7 | 134.3 | 123.0 | 628.1 | ||||
| Kapuskasing | 2018 | 24.1 | 9.1 | 15.8 | 133.8 | 82.7 | 604.8 | |||
| 30 Yr. Avg. | 22.1 | 8.6 | 17.3 | 124.2 | 115.6 | 552.2 | ||||
|
|
Table Updated Daily at www.weatherinnovations.com/weeklyweather.cfm | |||||||||
| This Report includes data from WIN and Environment Canada | ||||||||||