Plot Comments
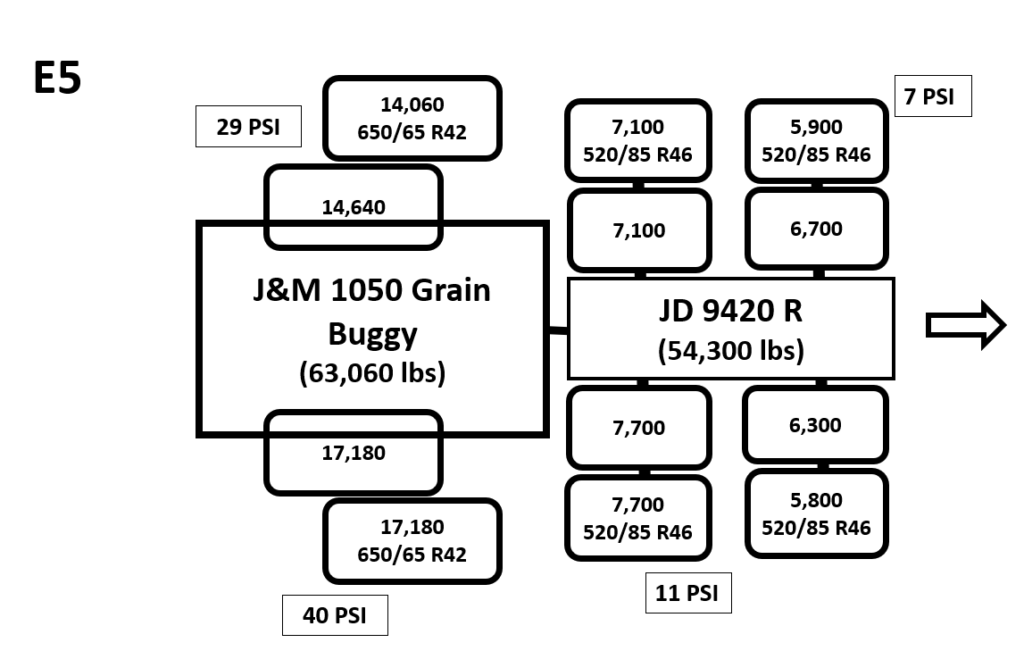
- This vehicle compared high inflation pressure and low inflation pressure for the grain cart.
- Notice also the high inflation tire was ~3000 lbs. heavier.
- Notice the last peak on the plots is slightly higher for the plots names E5_1 and E5_2.
- Also notice the much higher overall response for the plots for the first sensor installation E5L_1 and E5_1. This may be explained due to differences in soil properties.
- The first two peaks on all plots were the tractor tires but do not account for the peak pressure so should be ignored in this instance.