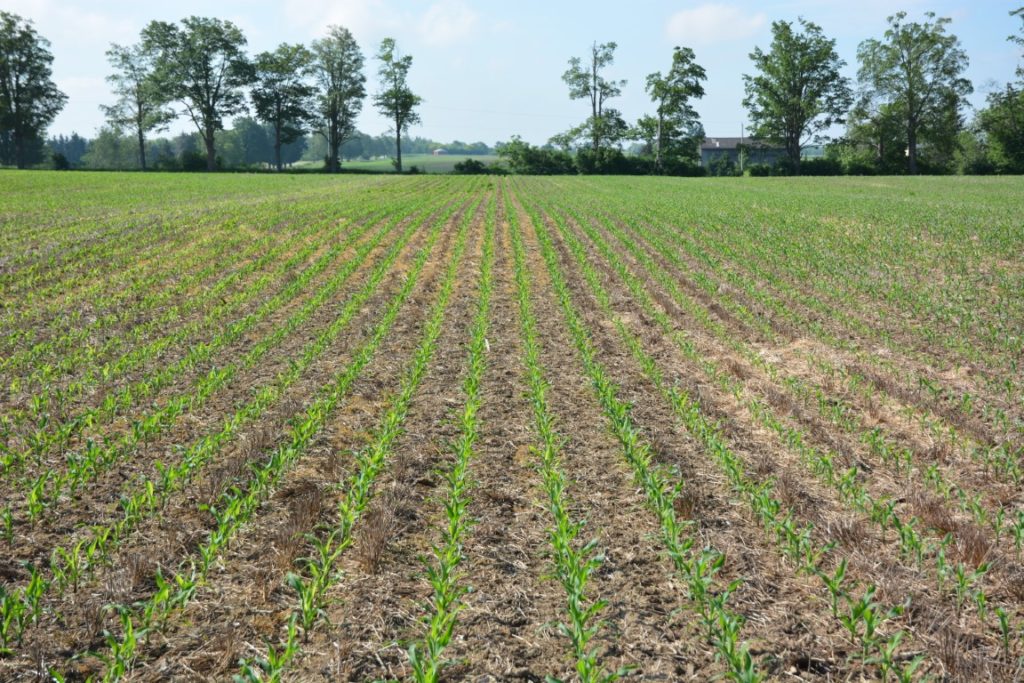
Some corn was planted around 10th of April. A much larger acreage got in between the 21st and 27th. The rest got in during the first part of May. Corn planted to date has gone in under very good soil conditions for the most part. The remainder of the corn will be likely planted after the 21st of May due to recent rains that will keep planters out of the fields.
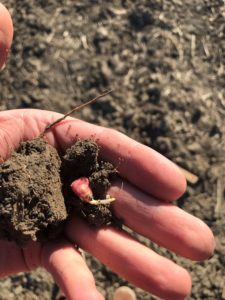
Regardless of the planting date so far, little or none of that corn has emerged. Why? Its primarily do to the overly cool conditions through April and the first part of May. While the seed has been taking many days to emerge, the seed remains in good condition. Planting was accomplished into very fit soils. While there was sufficient moisture for good seed-soil contact and initiating the germination sequence, the soils were not water saturated which is the biggest culprit to seed integrity in the soil. While the cool conditions have slowed emergence they have also reduced insect and disease pests from attacking the planted seed.
The Crop Heat Units (CHU’s) system has two major uses in Ontario. Firstly, corn hybrids are selected for a farm based on the region of the province. The CHU’s have been determined for regions based on long term temperature averages experienced in different geography’s of Ontario. Figure 1-1 from OMAFRA Publication 811 shows these regions. Note that they are based on the total seasonal CHU’s starting May 1st. Hybrids are rated by the seed companies based on their days to maturity and CHU rating. Farmers make the choices for their farms based on this map and the recommendations of their seed sales people who have explored the adaption of their hybrids across the province and categorized them so.
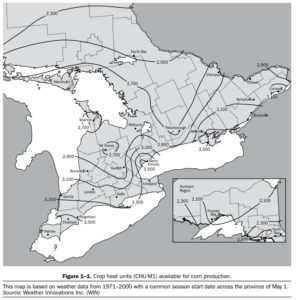
Secondly, CHU’s are used to gauge the development of crops. So while CHU’s are accumulated during warm days in April, their contribution to the seasonal totals tends to be small and quite varied from year to year. So, if in a given year, 150 CHU were accumulated because of an “early spring”, they would start a corn seed on its growth journey. However, can we count on that accumulated heat each year such that we would add them to the map in Figure 1-1? Not likely since 1. we can’t count on that heat each April, and 2. it doesn’t account for the potential for frost events like we saw the week of May 10th. I don’t think anyone would be well served by adding 150 CHU’s to the areas in Wellington, Bruce, Grey and other similar counties.
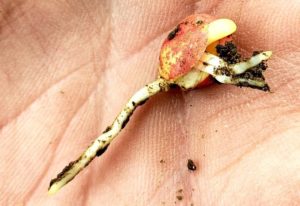
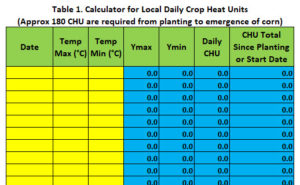
That being said, if CHU’s are accumulated in April they do contribute to corn development by stimulating the germination and underground growth of the corn seed. Corn requires ~180 CHU’s from planting to emergence.
CHU’s are accumulated based on the following equations:
- Daily CHU = (Ymax + Ymin) ÷ 2 WHERE:
- Ymax = (3.33 x (Tmax–10)) – (0.084 x (Tmax–10)2) WHERE:
Tmax = Daily maximum air temperature (°C) (measured from midnight to midnight)
AND
- Ymin = (1.8 x (Tmin – 4.4)) WHERE
Tmin = Daily minimum temperature (°C)
(If Ymax and Ymin values are negative, set to 0)
While official CHU counting begins May 1st, there are still “triggers” for both Tmax (10°C) and Tmin (4.4 °C) once official counting has begun. The development of the CHU system for calculating heat units found that below these daily minimum temperatures there was no appreciable heat accumulated which contributed to corn development so the formula accounts for that. For example if the daytime high temperature was 9°C and nighttime 3°C, the calculation would result in a “zero” value for accumulated CHU’s on that day.
Many farmers now have access to daily CHU data on their farm through their subscriptions with various crop consultants and service providers or have secured automated weather stations for their farms. If you do not have this available, we have developed some tools to you to understand where things are in your region or you can track yourself. Download these tools for use on your own computer.
- Regional CHU Accumulations through April to current date in May
https://bit.ly/2020RegionalCHUToDate as a PDF
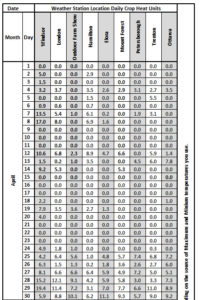
https://bit.ly/2020RegionalCHUToDateExcel as Excel workbook if you want to quickly add the CHU’s since your planting date using excel tools
- Excel tool for you to keep track of your individual farm CHU’s
Current and historical daily weather data is available from these sources:
https://www.timeanddate.com/weather/canada/guelph/historic
https://climate.weather.gc.ca/historical_data/search_historic_data_e.html
Resources that describe corn development are available from the following sources:
http://www.omafra.gov.on.ca/english/crops/pub811/pub811ch1.pdf page16
http://www.maizex.com/news/blog/corn-emergence-cool-spring
https://www.pioneer.com/us/agronomy/soil_temp_corn_emergence.html
https://ipcm.wisc.edu/download/pubsGuides/UW_CornDevGuide.pdf
https://www.agry.purdue.edu/ext/corn/news/timeless/Emergence.pdf
https://www.agry.purdue.edu/ext/pubs/AGRY-97-07_v1-1.pdf
The bottom line is that despite the long period from planting to emergence of some corn fields this spring, the seed is in good shape and will be emerging shortly.