Sebastian Belliard, spécialiste de la gestion des sols, MAAARO
La gestion des microorganismes du sol est peut-être le nouvel horizon à cibler pour améliorer la santé du sol, mais une chose n’a pas changé : on ne peut pas améliorer un sol qui n’existe plus ! Réduire l’érosion au minimum est donc la première étape d’un plan de gestion de la santé du sol.
Il y a un vieux dicton qui dit « on ne peut gérer que ce que l’on peut mesurer », mais en réalité l’érosion des sols est quelque chose de très compliqué, même pour les experts. Il n’est pas nécessaire de mesurer les isotopes de césium le long de la pente du champ. Ce qu’il faut, c’est atténuer les risques d’érosion.
Il y a quelque temps, afin d’estimer le risque d’érosion d’un champ, il fallait télécharger et apprendre à utiliser un logiciel particulier en vue d’effectuer les calculs requis pour résoudre l’équation universelle révisée des pertes de sols (RUSLE2). Les calculs exigent la collecte de données précises comme la longueur et l’inclinaison de la pente, lesquelles doivent être mesurées dans le champ ou estimées à partir de données topographiques recueillies à la ferme. Ces exigences compliquent l’évaluation du risque d’érosion et même en effectuant les calculs, on n’obtient qu’un chiffre. Est-ce suffisant? On a développé des méthodes perfectionnées pour établir les besoins en engrais, pourquoi ne pourrait-on faire de même pour évaluer les risques d’érosion? C’est maintenant possible.
En effet, un outil d’évaluation de l’érosion hydrique a été ajouté à l’Atlas de l’information agricole (AgriCartes). L’outil utilise l’équation RUSLE2 en arrière-plan en vue de calculer la quantité de sol perdue en raison de l’érosion hydrique au niveau du sous-champ. On obtient ainsi une carte du risque inhérent d’érosion hydrique qui calcule le risque en fonction de facteurs topographiques et pédologiques, ainsi qu’une carte d’estimation de l’érosion hydrique annuelle qui tient compte de la culture en place et des méthodes de travail du sol utilisées (le facteur « C » de l’équation RUSLE 2). Le présent article explique comment utiliser l’outil.
Utilisation de l’outil d’évaluation
Étape 1. Parcourir le site pour atteindre l’outil.
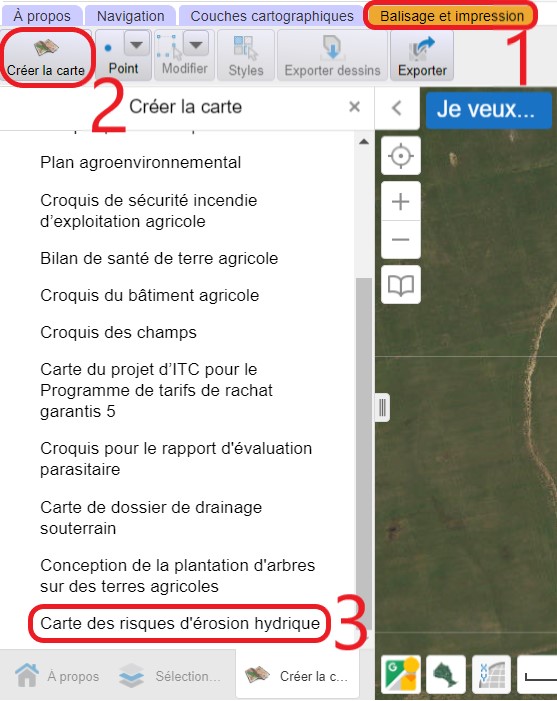
Une fois qu’AgriCartes est ouvert, cliquer sur l’onglet « Balisage et impression ». Puis, cliquer sur « Créer la carte » et faire défiler le curseur jusqu’à « Carte des risques d’érosion hydrique ».
Figure 1. Navigation jusqu’à l’outil sur les risques d’érosion hydrique.
Étape 2. Sélectionner le champ.
Figure 2. Risque inhérent d’érosion hydrique.
Faire un panoramique du champ. Il est également possible de passer à l’imagerie satellite (à droite de l’outil Street View de Google) lorsqu’on s’approche du champ.
Une fois que le champ apparaît à l’écran, cliquer sur le bouton polygonal « Limite du champ/Zone portant à intérêt ». Pour délimiter le champ, cliquer d’abord sur un coin, puis chaque fois qu’une limite est tracée. Pour compléter le périmètre du champ, double-cliquer le dernier point et la dernière ligne entre le dernier et le premier point sera créée automatiquement formant ainsi le polygone. On peut alors entrer le nom de l’exploitation agricole et le nom du champ.
L’outil va alors calculer automatiquement le risque inhérent d’érosion hydrique pour tout le champ, avec des codes de couleur selon l’intensité du risque. Il s’agit de l’ampleur de l’érosion qui se produirait si le champ était laissé dénudé pendant un an. On devrait reconnaître alors les éléments qui correspondent à la longueur de la pente, à son inclinaison et au type de sol.
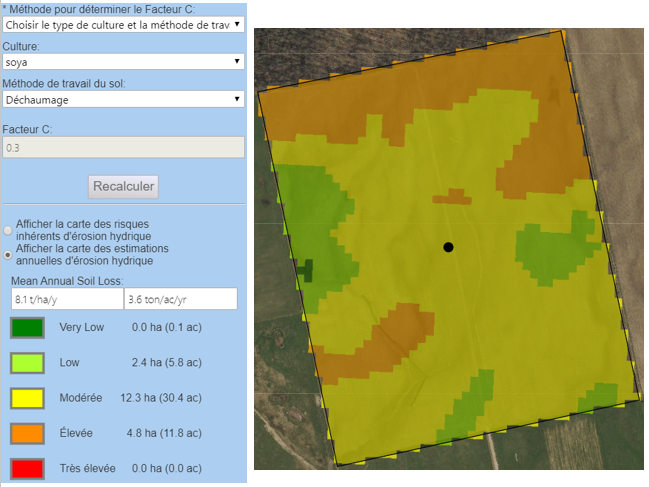
Figure 3. Carte des estimations annuelles d’érosion hydrique pour un champ de soya en travail minimum du sol.
Étape 3. Établissement dufacteur C.
Afin d’estimer l’érosion qui risque de survenir avec les pratiques utilisées actuellement, on doit d’abord établir le facteur C, lequel reflète à quel point les cultures et les pratiques de travail du sol utilisées atténuent le risque inhérent d’érosion. Une fois que la culture et la méthode de travail du sol sont sélectionnées, cliquer dans la case située à côté de « Afficher la carte des estimations annuelles d’érosion hydrique » afin de connaître à quel point le risque d’érosion a été atténué. On peut changer les pratiques de travail du sol et recalculer le tout pour vérifier l’effet qu’aurait un système différent.
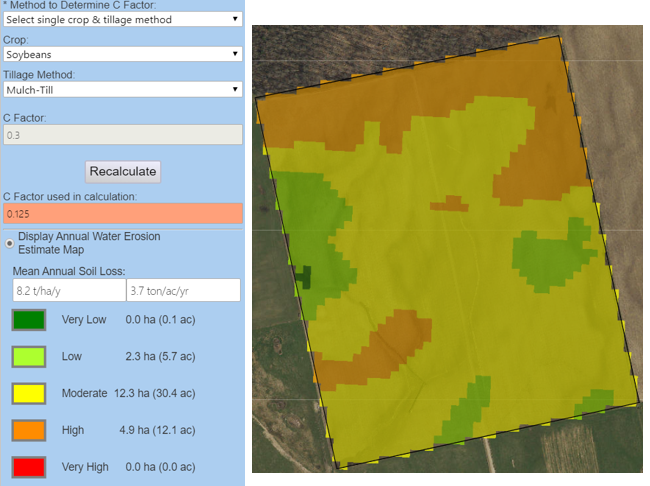
Le soya cultivé sous paillis (c.-à-d. avec un travail minimum du sol) donne un facteur C de 0,3 et réduit l’érosion du sol de 12,2 tonnes/acre/an pour un sol nu à 3,7 tonnes/acre/an (figure 3). Dans le cas du soya en semis direct (sans travail du sol), ce facteur peut être réduit jusqu’à 1,5 tonne/acre/an (figure 4).
Figure 4. Carte des estimations annuelles d’érosion hydrique pour un champ de soya en semis direct.
Limitations
Il est évident qu’il existe d’autres facteurs contribuant à l’érosion dans un champ que la culture en place et le type de travail du sol. La teneur en matière organique et le degré de compactage vont aussi avoir un effet sur la quantité d’eau qui s’infiltre dans le sol ou qui ruisselle. L’outil ne tient pas compte actuellement de ces facteurs.
Le champ illustré dans l’exemple présente une topographie complexe et des pentes qui convergent vers un fossé. Il s’agit là de conditions qui augmentent le risque d’érosion par ravinement causé par des ruissellements intenses, mais le programme RUSLE2 sur lequel est basé l’outil ne calcule actuellement que l’érosion en nappe.
Mises à jour
L’outil actuel représente la première phase sur quatre. La deuxième phase permettra de calculer le risque d’érosion par ravinement, et la troisième phase va intégrer le risque associé au travail du sol; enfin, la quatrième et dernière phase prévoit recommander le meilleur emplacement pour des mesures de lutte comme les voies d’eau gazonnées. Ces mises à jour seront publiées au cours de deux ou trois prochaines années.
~~~
Sebastian Belliard, Soil Management Specialist, OMAFRA
While managing soil microbes might be the newest frontier to improving soil health, one thing has not changed: you cannot improve soil you no longer have! Minimizing erosion is the first step in a soil health management plan.
The old adage says: “you can only manage what you measure”, but actually measuring soil erosion is very complicated, even for experts in this field. There’s no need to measure Cesium isotopes along that slope in your field. What needs to be managed is the risk of erosion.
It used to be that in order to estimate the erosion risk of a field you had to download and learn to use specific software to perform the calculations required for the Revised Universal Soil Loss Equation (RUSLE2). The calculations require specific inputs like slope length and steepness that must be measured in the field or derived from topographic data collected on the farm. These are all barriers to actually doing an erosion risk assessment, and even then, the result is a single number. Is this good enough? We have moved to much more refined ways of determining fertilizer requirements, why can’t we do the same for erosion risk? Now we can.
A water risk erosion tool has been added to the Agricultural Information Atlas (i.e. AgMaps). The tool runs RUSLE2 in the background to calculate the amount of soil lost to water erosion at a sub-field resolution. The results are an inherent water erosion potential map that calculates the risk based on soil and landscape factors, and an annual water erosion estimate map that takes the current crop and tillage practices into account (the ‘C’ factor from RUSLE 2). This article will explain how to run the tool.
Running the Tool
Step 1. Navigate to the tool
Once you have opened AgMaps, click on the ‘Markup and Printing’ tab. Then, click the ‘Create Map’ button and scroll down to ‘Water Erosion Potential Map’.
Figure 1. Navigating to the Water Erosion Potential tool.
Step 2. Select the field
Figure 2. Inherent Water Erosion Potential.
Pan to your field on the map. You may want to switch to satellite imagery view (right of the Google street map button) as you get closer.
Once the field is on the screen, click the polygon button under ‘Field Boundary / Area of Interest’. To outline the field, first click on one corner, then click again every time you end a line. To complete the outline, double click the last point – the last line between your last and first points will be created automatically to complete the polygon. You may now enter your farm and field name.
The tool will now automatically calculate the inherent water erosion potential for the entire field, colour coded by severity. This is the amount of erosion that would occur if the field were left bare for a year. You should recognize patterns that correspond to slope length, steepness, and soil type.
Figure 3. Annual Water Erosion Estimate Map with soybeans and minimum tillage.
Step 3. Determine C factor
To calculate the erosion estimated to occur with current practices, the ‘C’ factor must be determined. This is a factor that determines how well the current crop and tillage practices mitigate the inherent erosion potential. Once you have selected your crop and tillage method, click beside ‘Display Annual Water Erosion Estimate Map’ to show how much erosion potential has been mitigated. You can change tillage methods and recalculate to see what effect a different system would have.
Soybeans with ‘mulch-tillage’ (i.e. minimum tillage) provide a C factor of 0.3 and reduce the erosion from the field from 12.2 ton/ac/yr for bare soil to 3.7 ton/ac/yr (Figure 3). If the soybeans were no-tilled, that could be further reduced to 1.5 ton/ac/yr (Figure 4).
Figure 4. Annual Water Erosion Estimate Map with soybeans and no tillage.
Limitations
There are clearly more factors that determine erosion in a field than the current crop and tillage method. Organic matter levels and compaction status will influence how much water infiltrates or runs off. The tool currently does not include these factors.
This example field clearly has a complex topography and slopes that converge into a draw. These are conditions that increase the risk of gully erosion from concentrated flows, but the RUSLE2 program that lies behind this tool currently only calculates sheet erosion.
Updates
The current tool is published in the first of four planned phases. The second phase will make it possible to calculate the risk of gully erosion, while the third will integrate tillage erosion risk, and a final fourth phase will indicate the best placement of erosion control measures such as grassed waterways. These updates are planned for the next 2-3 years.