
Summary
- Pre Sidedress Nitrogen Test (PSNT) soil samples were collected from 94 sites across the province from June 8th to 10th, 2020
- The average PSNT value was 14 ppm, slightly above the long-term average of 12 ppm.
- Optimal nitrogen (N) rates are a function of both soil N supply and yield. Consider both when determining N rate requirements in 2020.
- PSNT survey results are a general indication of soil N status, not a substitute for actual sampling.
Background
OMAFRA Field Crop Unit staff have traditionally led an annual Pre Sidedress Nitrogen Test (PSNT) survey across Ontario at the beginning of June to measure soil nitrate mineralized from the soil as an indication of year-to-year soil nitrogen status. In past years, 80-100 samples would be collected from fields across the province that had not yet received nitrogen. Soil samples are collected when corn has generally reached the V3-V4 stage, just prior to traditional sidedress time.
PSNT Survey
Nitrogen mineralization is favoured by warm soil conditions with adequate soil moisture and aeration. Excess moisture, especially under warm temperatures, can slow mineralization, or increase the potential for losses through denitrification or leaching.
The spring of 2020 arrived relatively early. With sunshine and very little rainfall, soil conditions were generally great through April and early May. A period of record cold temperatures dominated for a 1-2 week period mid-May, which was followed by a couple weeks of seasonal to well above seasonal temperatures. Variability in temperatures on both extremes brought into question how N mineralization may be affected in 2020.
A total of 94 samples were collected from across the province, representing a range of previous crops, soil textures and geographies of Ontario. Samples were collected from June 8-10 for a V3-V4 stage target sampling. Due to variability in rainfall and planting dates, crop stage ranged from V1 to V5. Where corn fields without preplant N could not be found, soybean fields were sampled if rotations were representative of grain corn (following wheat or soybeans).
Survey Results
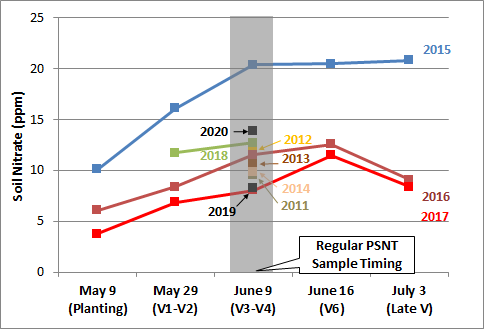
The overall average PSNT value for the 2020 survey was 14 ppm. This is much higher than 2019 (8 ppm) and slightly above the long-term average of 12 ppm from the previous 9 surveys (2011-2019, Fig 1), suggesting similar to slightly higher than normal mineralization by sidedress corn stage in 2020. For reference, these levels compare most to years 2012 and 2018 (Fig 1).
Figure 1. Soil nitrate sampling results for various sample timings, 2011-2020.
Recommendations
PSNT soil nitrate values are similar to slightly above the long-term survey average, suggesting soil nitrogen release may be similar to slightly ahead of where it normally is by traditional sidedress stage. This suggests adjustments from a soil nitrogen supply perspective may not be required in 2020.
In General:
- Every 5 ppm change in soil nitrate usually changes PSNT N recommendations by 25-30 lb-N/ac
- Every 1 bu/ac change in yield expectation usually changes OMAFRA N recommendations (N-calculator and PSNT recommendations) around 0.80 lb-N/ac.
How Do I Know if My N Rates are Correct?
If you don’t measure, you don’t know. One simple way to evaluate N rates is to apply test strips 30 lb-N/ac above and below your normal N rates to get a feel for how corn responds on your fields. A history of N rate strips can provide an indication if your N rates are close to right, or could be adjusted up or down, and may provide guidance for changing rates for different environments (fields, years).
Application To Your Fields
The values in this report are a crude relative indication only and should not be used as a recommendation for nitrogen rates on any given farm or field. Soil nitrates are highly influenced by the environment (soil texture, organic matter, local weather, previous management). For instance, if you are in an area that has received significantly more rainfall than other parts of the province, you may have experienced less mineralization or more loss than is reflected in these results. The only way to know soil nitrate concentrations on your own farm is to pull soil nitrates from your own fields.
PSNT Sampling
Collect several 12″ soil samples across a field using a soil probe. Sample parts of fields separately if there is reason to suspect differences in N content (different field history, soil type, topography etc.). Make a well-mixed representative sub sample (1 lb) to fill a lab box or bag. Samples should be chilled to prevent further N mineralization and sent to a lab as soon as possible.
OMAFRA PSNT recommendations are only calibrated for where soil nitrate samples are measuring naturally mineralized N and should not be used where N fertilizer has been applied. A modest amount of N applied with banded or in furrow starter (ie. 30 lb-N/ac) is OK provided sampling can be done mid-row to avoid these bands. Due to differences in N mineralization timing, recommendations in corn fields with manure, red clover or alfalfa in the previous year are more accurate when using nitrogen credits from Pub 811, Agronomy Guide for Field Crops.
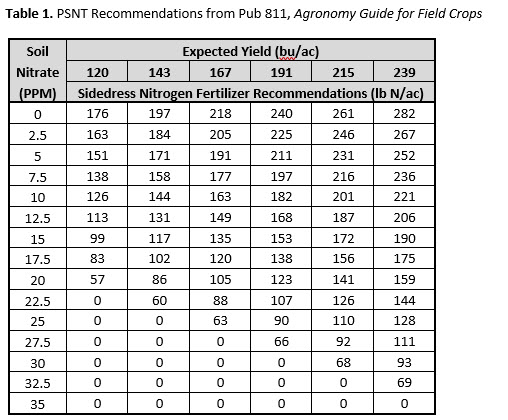
OMAFRA revised PSNT recommendations in 2015 to include both soil nitrate measurement and expected yield (Table 1).
Acknowledgements
Sincere thanks to the growers, industry and organization participants (Agronomy Advantage, Benjamins Agronomy Services, FS Partners, Grain Farmers of Ontario, Maizex Seeds, P.T. Sullivan Agro, University of Guelph Ridgetown Campus) and OMAFRA staff who provided fields for sampling or collected soil nitrate samples.
Thanks to Grain Farmers of Ontario and SGS Agri-Food Laboratories Guelph for financial support of the annual PSNT survey.