The Ontario Virtual Crop Diagnostic Event will replace all in-person provincial crop diagnostic days that have been postponed this season due to the COVID-19 pandemic. The first series of diagnostic learning sessions begins on Wednesday July 15, 2020. For more information and to register go to OMAFRA Virtual Diagnostic Days Series website.
While the management window for much of our field crops is closing, some late fertility, and insect monitoring, and control remains important to stay on top of.
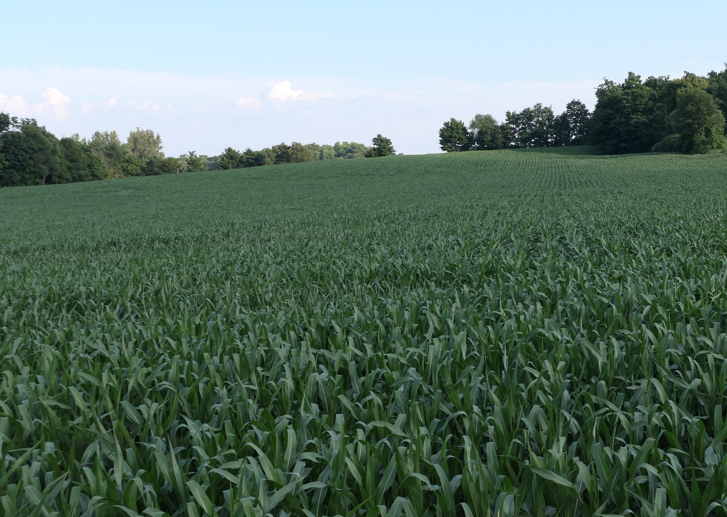
Wheat harvest has started. Most corn and soybean fields have closed canopy and are experiencing rapid growth with the heat. Field crops in many parts of the province are showing signs of moisture stress made worse by the extended high temperatures.
Nitrogen Applications
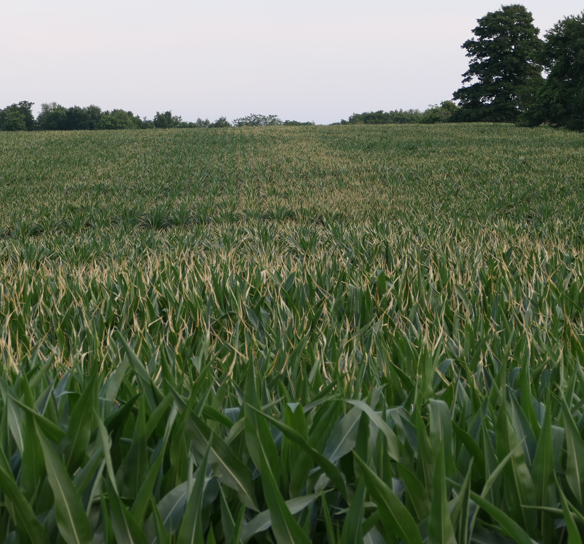
Late nitrogen application in corn is happening now. With the hot dry weather there has been significant visual leaf burn from high clearance spinner spreader applications of dry nitrogen (Figure 1). Injury happens when fertilizer prills land in the leaf whorl. Condensation which forms on leaves overnight and moves into the whorl dissolving the prills and allowing for rapid N uptake by the tender leaf tissue. This N moves with transpiration to the leaf margins where accumulation causes leaf burn. It is often very visual but yield impacts are generally minimal. The exception might be where the fertilizer sources are dusty and do not spread evenly, resulting in excess amount directly behind the applicator.
While split nitrogen applications in corn are a good management strategy, very late applications can create challenges. Nitrogen is primarily taken up dissolved in soil water by the roots. Lack of timely rainfall after application means that surface applied nitrogen may not move into the root zone in a timely manner and potentially leads to losses. Earlier side dress timings are more likely to give surface applied nitrogen a greater chance of receiving timely rainfall to move N into the soil. While the trend has been away from side dress injection, putting N directly in the soil does offer a greater chance of nitrogen being available to the crop in a timely fashion. The probability of losing nitrogen from the traditional sidedress timing compared to these later applications is relatively low. For producers trying to ensure N supply for post-pollination uptake, the traditional side dress timing should have the same opportunity as the later applications to make this possible with better opportunity to have it in the soil.
Insect Pests Continue to Require Attention
Hot dry conditions tend to increase insect issues. There have been significant armyworm reports with a lot of wheat fields sprayed ahead of harvest. As winter wheat gets harvested larvae will move to other grassy crops such as spring cereals, grassy forage stands and corn.
Be on the lookout for spider mites in the bean crops as hot dry weather persists. They will move into soybean and edible bean crops as wheat is harvested. Their populations can explode rapidly. Scouting is imperative to ensure timely control when warranted. The action threshold is 4 mites per leaflet or 1 severely infested plant, prior to pod fill. They are very difficult to see without a lens! Damage is stippling (dots) on the upper leaf surface from the chewing mouth parts that collapse individual plant cells, and plants appear sandblasted or dusty on the underside. From the road a soybean field may look grey if there is an infestation, or brown if the leaves are dropping off and the plants are shutting down and dying.
In alfalfa and dry beans, be on the lookout for potato leafhopper (PLH). Once symptoms of damage appear, yield has been impacted. Scouting is key to staying ahead of PLH. These tiny pests are hard to spot and count because the adults “hop” or fly off the plant! The threshold for control depends on forage height or bean growth stage. In alfalfa, mowing will usually control PLH and encourage new regrowth from the crown. Scout after harvest, as leafhoppers can reinfest and impact the new growth; if PLH are still above threshold after mowing, a spray may be warranted.
Manure Timing
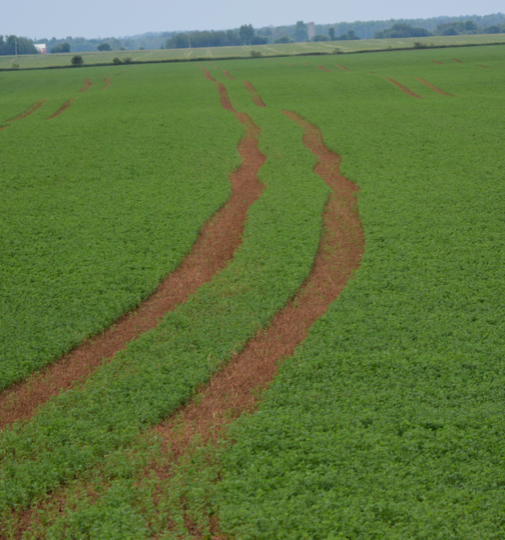
Where manure application occurs on harvested forage stands, ensure spreading happens shortly after harvest since the stress of the tanker/spreader weight can be damaging to alfalfa crowns once they have started to regrow (Figure 2). This impacts subsequent forage yield and overwintering tolerance.
Current Crop Stress Offers Learning Opportunities
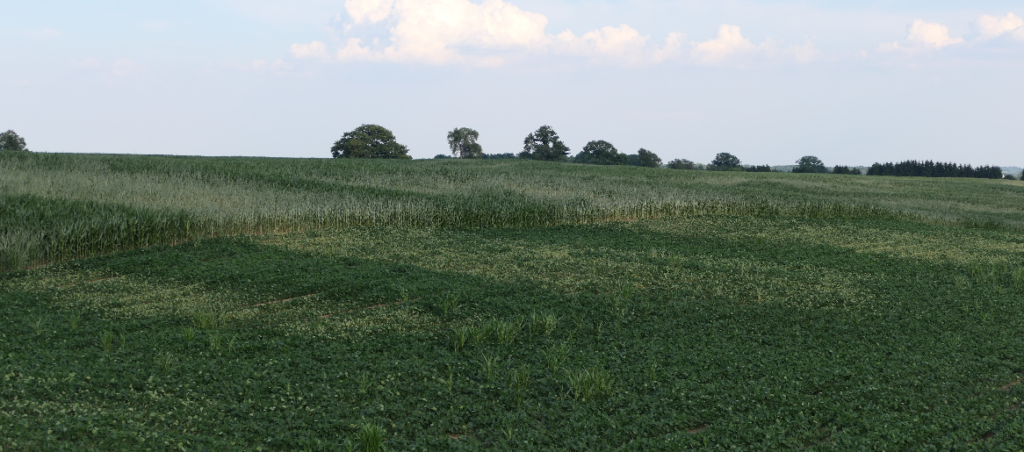
When crops are growing under stressed conditions, it becomes very obvious the impact of management choices. There are many examples of tremendous crops across the province, but equally there are many stressed fields. Taking the time to observe and record differences and their possible causes can help your overall crop management in the future (Figure 3). It’s important to determine if stress response is based on specific management choices or under lying natural variability (ie soil texture, soil parent material, etc).
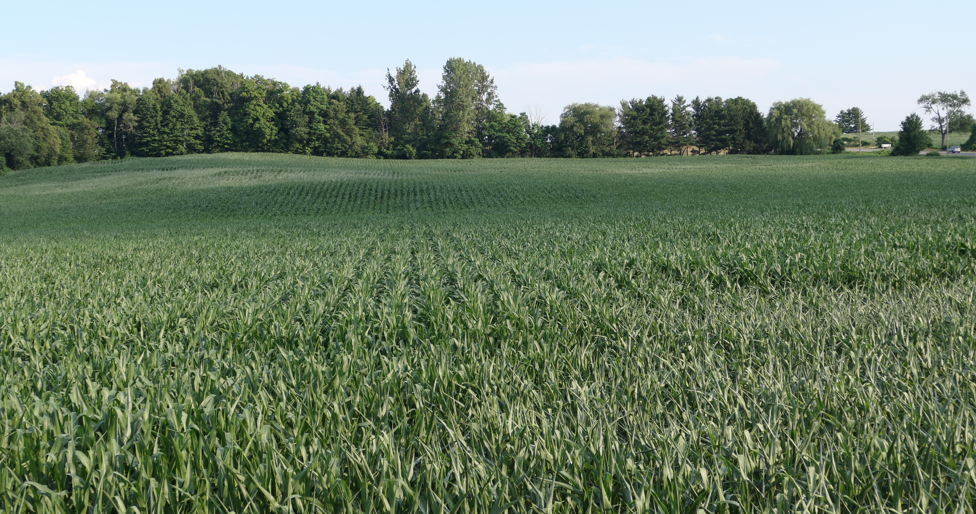
Ask yourself, why do some fields look better than others (Figure 4 and 5)? Is it a variety/hybrid issue? Is it the tillage system, crop rotation, fertility program choices that are causing the differences? Often, it is a management practice that is the culprit. If your fields are looking tough compared to your neighbour, have a chat with them (being mindful of physical distancing guidelines) and see if you can learn some new tricks that can improve your crops in future.
Walk your fields, even taking a walk-through tall corn offers many teachable moments. Check out local variety/hybrid trials and other agromony plots in the neighbourhood. Are some of those new offerings handing the heat and moisture stress better than others? Take some notes and refer to them in the fall when you have trial results. Did a more heat/moisture tolerant plant in July result in higher yield at harvest?
Environmental stresses, like insufficient moisture, often magnify other stresses, like soil compaction. Get out in those fields with a shovel and dig up some plants from the good and tough areas of the field to compare root growth. Use a tile probe to identify for compaction layers. If differences can be detected, explore what might have led to those differences. Work with your agronomists and others to get the most learning you can.
Successful decision making is done with good data. Take the opportunity to gather all the valuable data that the current conditions are making available. This should lead to better outcomes in the future.
For more detailed information on topics covered in this report, go to www.fieldcropnews.com and search the following terms:
- “armyworm”
- “spidermites”
- “leafhopper”
June 29 to July 5, 2020 Weather Summary
| Location | Temp high °C | Temp low °C | Rain (mm) | Total Rain (mm)* | GDD (Base 0°C)* | GDD (Base 5°C)* | CHU* |
|---|---|---|---|---|---|---|---|
| Harrow (2020) | 32.9 | 15.7 | 0 | 209.5 | 1342 | 884 | 1319 |
| Harrow (2019) | 32.4 | 15.1 | 12.2 | 323.5 | 1288 | 834 | 1178 |
| Ridgetown (2020) | 32.6 | 12.8 | 0 | 170.6 | 1284 | 830 | 1243 |
| Ridgetown (2019) | 31.7 | 11.6 | 9.5 | 282.4 | 1220 | 768 | 1112 |
| London (2020) | 32.6 | 13.3 | 0.1 | 194.6 | 1223 | 778 | 1164 |
| London (2019) | 33.4 | 11.6 | 5.1 | 305.9 | 1137 | 706 | 1045 |
| Brantford (2020) | 33.8 | 12.7 | 0 | 159.2 | 1234 | 786 | 1153 |
| Brantford (2019) | 33.5 | 11.3 | N/A | 273.6 | 1183 | 739 | 1100 |
| Welland (2020) | 31.4 | 15 | 0 | 183.7 | 1254 | 808 | 1213 |
| Welland (2019) | 31.4 | 12.8 | 9.8 | 300 | 1244 | 784 | 1157 |
| Elora (2020) | 30 | 11.3 | 0 | 156.6 | 1139 | 703 | 1072 |
| Elora (2019) | 31.6 | 9.9 | 6.9 | 324.5 | 1087 | 647 | 1013 |
| Mount Forest (2020) | 29.6 | 13.1 | 0 | 203.6 | 1127 | 703 | 1077 |
| Mount Forest (2019) | 31.4 | 10.6 | N/A | 129.4 | 1068 | 635 | 999 |
| Uxbridge (2020) | 31.6 | 13.6 | 0.4 | 134.7 | 1146 | 720 | 1105 |
| Uxbridge (2019) | 30.3 | 9.7 | N/A | 226.9 | 1053 | 615 | 948 |
| Peter-borough (2020) | 33.6 | 12.4 | 0 | 135.2 | 1168 | 720 | 1095 |
| Peter-borough (2019) | 31.9 | 9.5 | 0.4 | 292.1 | 1095 | 646 | 979 |
| Trenton (2020) | 30.5 | 14.9 | 0.2 | 176.5 | 1160 | 721 | 1097 |
| Trenton (2019) | 32.1 | 12.8 | 6.2 | 289.9 | 1196 | 734 | 1098 |
| Kemptville (2020) | 31.1 | 12.6 | 0.6 | 130.5 | 1214 | 759 | 1144 |
| Kemptville (2019) | 31.8 | 11.9 | N/A | 203.3 | 1141 | 693 | 1030 |
| Earlton (2020) | 31.7 | 9.9 | 7.7 | 218.3 | 1019 | 619 | 981 |
| Earlton (2019) | 31.9 | 10.5 | 2.2 | 295.8 | 866 | 485 | 807 |
| Sudbury (2020) | 33.5 | 14.3 | 12.2 | 200.4 | 1027 | 621 | 978 |
| Sudbury (2019) | 30.8 | 10.8 | 6 | 277.1 | 861 | 486 | 792 |
| Thunder Bay (2020) | 34.1 | 13 | 12.6 | 92.8 | 998 | 581 | 934 |
| Thunder Bay (2019) | 29.7 | 9.6 | 29.4 | 203.6 | 790 | 407 | 676 |
| Fort Francis (2020) | 33 | 11.4 | 9.5 | 165.6 | 1095 | 670 | 1053 |
| Fort Francis (2019) | 29.9 | 6.8 | 18.2 | 158.8 | 923 | 510 | 818 |
* Rainfall and Growing Degree Days (GDD) totals tallied since April 1. Crop Heat Unit (CHU) totals tallied from May 1