Managing to get the most from available water
Water is the most important limiting input for crop production. In more than a couple of the past years, producers across the province have been forced to watch while their crops suffer from dry conditions in the heat of summer.
Other than irrigation (which is rare for field crops in Ontario), there’s really nothing we can do to manage how much water we get and when we get it. For that reason, it makes more sense to think about how we might lose it – and how we can keep it.
Striking the Water Balance
On the opposite side of the water balance equation from inputs (precipitation and irrigation) are losses – runoff, deep drainage, and evapotranspiration – and the soil storage component. The right lever to pull in this system will depend on the specifics of each operation and its soil landscape, so here are the broad concepts and some general recommendations for how to influence them to manage your risk for drought stress.
Deep drainage
As water moves through the soil, it eventually goes below the rooting zone and is essentially lost for crop production. This is an important natural process for recharging groundwater and the way that soils provide a water purification service.
Tile drainage essentially short-circuits this process, shunting groundwater into surface waterways. Water table management like this is critical for timely planting in most of the province and improves the drought tolerance of crops as it allows roots to develop deeper before dry conditions occur. However, we’re often left pining after that spring water once it gets dry in the summer. Controlled drainage systems allow for more refined water table management and allow us to keep water in the field when it’s needed. Once thought to be suitable only for flat fields, this technique is now also being applied on sloping terrain with drains installed on contour.
Evapotranspiration
Water evaporates from soil more quickly in hot, dry weather. It also evaporates more quickly from bare soil than from soil that is covered, either by residue or by plant canopy (Figure 1). Bare soil competes with the crop for water just like weeds do. Overwintering cover crops can provide the best of both – transpiring excess water in the spring and providing mulch to cover the soil until the crop canopies. “Planting green” – into living cereal rye terminated soon after planting, for example – is an effective strategy for soybeans.

Runoff is a terrible way to lose water, because it usually also means losing soil. The erosive power of runoff is related to its speed, so anything that can slow the water down will help. Residue cover is the first step – 100% residue cover results in negligible erosion, but 50% cover still reduces erosion by 80%. This level of residue is usually achieved with no-till. A recent meta-analysis of runoff and tillage systems showed that no-till reduced runoff by over 20% on average compared with other tillage systems (Figure 2). The residue cover in a no-till system reduces crusting, and the lack of disturbance results in higher pore continuity, meaning more infiltration and percolation.

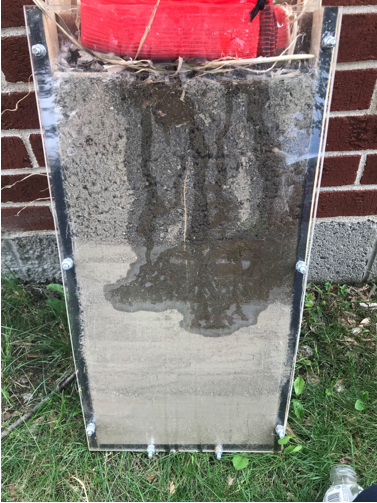
The devil is in the details, though. No-till fields may experience more runoff than tilled soils if they are left bare from residue harvest (i.e. straw removal or low-residue crops (e.g. soybeans) if their surfaces are smoother than tilled fields. This is where cover crops come in. Even in tilled systems, the pores created by cover crop roots can increase infiltration of a heavy rainfall event by 17% (Yu et al., 2016). Figure 3 shows a soil infiltration demonstration that provides a good visual of how coarse and fine root channels help move water through the soil. Cover crops with coarse roots (e.g. daikon radish) and those with very dense root systems (e.g. cereal rye) provide the most benefit.

Store it in the Soil
Making the best use of the water we get in a season means getting it in the ground, but also keeping it there and making sure it’s accessible to crop roots. A well-structured soil with a range of pore sizes will hold the most plant-available water. In a compacted soil, root access to water may be limited by soil resistance even before water levels fall below the permanent wilting point (Figure 4.)

If what’s noted above makes you think that you don’t need to worry about water because you are already no-tilling, think again. Tillage is a tool for dealing with compaction. If you take it out of the toolbox, extra care is required to avoid squeezing your soil of its water holding capacity.
Weather Summary
|
Weekly Weather Summary August 10-16 |
|||||||||
| Location | Date | Temperature | Rainfall | Totals | |||||
| August 10 -16 | Max | Min | (mm) | Rain | GDD0 | GDD5 | CHU | ||
| °C | °C | 01-Apr | 01-Apr | 01-Apr | 01-May | ||||
| Harrow | 2020 | 31 | 13 | 11 | 307 | 2266 | 1609 | 2447 | |
| 2019 | 28 | 13 | 2 | 370 | 2243 | 1579 | 2344 | ||
| Ridgetown | 2020 | 30 | 12 | 16 | 314 | 2176 | 1522 | 2316 | |
| 2019 | 28 | 11 | 9 | 514 | 2123 | 1461 | 2209 | ||
| London | 2020 | 30 | 12 | 8 | 338 | 2112 | 1466 | 2230 | |
| 2019 | 31 | 11 | 25 | 452 | 2030 | 1390 | 2130 | ||
| Brantford | 2020 | 32 | 12 | 0 | 211 | 2143 | 1495 | 2220 | |
| 2019 | 30 | 10 | N/A | 274 | 2104 | 1449 | 2191 | ||
| Welland | 2020 | 31 | 13 | 0 | 269 | 2162 | 1516 | 2321 | |
| 2019 | 28 | 10 | 5 | 362 | 2165 | 1495 | 2286 | ||
| Elora | 2020 | 30 | 10 | 1 | 281 | 1975 | 1340 | 2078 | |
| 2019 | 29 | 8 | 2 | 359 | 1673 | 1083 | 1713 | ||
| Mount Forest | 2020 | 30 | 11 | 9 | 396 | 1952 | 1327 | 2086 | |
| 2019 | 28 | 9 | N/A | 129 | 1903 | 1260 | 2001 | ||
| Uxbridge | 2020 | 31 | 11 | 8 | 264 | 2005 | 1380 | 2140 | |
| 2019 | 28 | 11 | N/A | 227 | 1898 | 1249 | 1971 | ||
| Peterborough | 2020 | 31 | 9 | 14 | 209 | 2024 | 1376 | 2098 | |
| 2019 | 29 | 6 | 2 | 334 | 1892 | 1243 | 1901 | ||
| Trenton | 2020 | 29 | 14 | 12 | 276 | 2115 | 1461 | 2275 | |
| 2019 | 29 | 11 | 9 | 354 | 2092 | 1420 | 2188 | ||
| Kemptville | 2020 | 31 | 12 | 36 | 261 | 2171 | 1506 | 2272 | |
| 2019 | 29 | 8 | N/A | 203 | 1999 | 1345 | 2037 | ||
| Earlton | 2020 | 32 | 10 | 6 | 316 | 1851 | 1241 | 1972 | |
| 2019 | 27 | 6 | 1 | 349 | 1589 | 1013 | 1653 | ||
| Sudbury | 2020 | 29 | 13 | 23 | 384 | 1872 | 1256 | 2005 | |
| 2019 | 27 | 9 | 0 | 351 | 1610 | 1040 | 1689 | ||
| Thunder Bay | 2020 | 29 | 9 | 1 | 181 | 1746 | 1129 | 1814 | |
| 2019 | 27 | 6 | 4 | 267 | 1556 | 968 | 1575 | ||
| Fort Francis | 2020 | 28 | 7 | 79 | 289 | 1862 | 1227 | 1947 | |
| 2019 | 27 | 6 | 0 | 292 | 1680 | 1061 | 1701 | ||
| This table developed by OMAFRA using data from Agriculture and Agri-Food Canada and Environment Canada. Max and Min Temps show the extremes that occurred for the 7-day period. | |||||||||