There are currently three key topics for forage production: nitrates, potato leafhopper, and planting annual forages for fall production.
Nitrate poisoning of livestock is a risk in a dry year
In a dry year, high nitrate levels in forages are a concern. Fast-growing grass species, such as corn, sorghum-sudangrass, and cereals are most likely to accumulate nitrates. Nitrogen moves from the soil into the plant with water. When a dry spell ends, the flush of water moving into crop roots brings a lot of nitrate-nitrogen with it. It takes 5-7 days for the crop to turn those nitrates into amino acids and proteins. If the crop is harvested before the nitrate is metabolized by the plant, elevated nitrate levels could cause nitrate poisoning in livestock.
Since nitrate levels tend to be highest in the lower part of the plant, many sources recommend raising the cut height to reduce the nitrate concentration in the feed. However, when feed inventories are tight, producers may prefer the cut at their normal height, test the forage for nitrates, and work with a nutritionist to dilute high-nitrate forage to a safe level. Labs that offer forage analysis typically offer nitrate testing, but it is not a part of the general forage nutritional analysis package.
Ensiling can reduce nitrate concentrations between 25-65%. Baleage is generally too dry to ferment completely, so do not expect baleage to reduce nitrate levels as much as ensiling. Nitrate levels are stable in dry hay; if they are high at harvest, they will always be high.
Make no assumptions – scout regularly to stay ahead of challenges
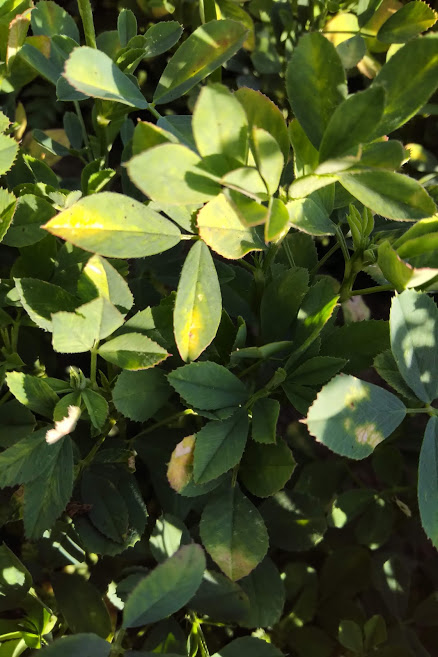
Potato leafhopper pressure is often high in hot, dry years and 2020 is no exception. Potato leafhopper feeding stunts alfalfa, then makes it turn yellow (called “hopper burn”; Figure 1). It is frequently mistaken for a lack of water. However, established alfalfa has deep taproots and is often more drought-tolerant than annual crops. Scouting will reveal whether potato leafhoppers are stressing the stand and, if so, enable producers to protect their yield.
Scouting for potato leafhopper should be done with a sweep net, but can be done with a fabric (not mesh) baseball cap. Since a ball cap is about 1/5th the size of a net, five times as many sweeps are needed to assess populations. With a net, take 20 sweeps from five areas of the field, avoiding field edges. The threshold for potato leafhopper changes with alfalfa height.
Table 1. Thresholds for potato leafhopper in alfalfa.
| Stem Height* | Potato Leafhoppers per Sweep** |
|---|---|
| 9 cm (3.5 in.) | 0.2 adults |
| 15 cm (6 in.) | 0.5 adults |
| 25 cm (10 in.) | 1.0 adults or nymphs |
| 36 cm (14 in.) | 2.0 adults or nymphs |
** 1 sweep = 180 degree arc
Whether or not hopper burn is visible, alfalfa with potato leafhopper populations at or above threshold require action to protect yield. Cutting is an important part of managing leafhoppers. Not only does cutting take away the insects’ food source, it also encourages the alfalfa crown to send up new stems to replace the stunted ones. Waiting will not improve yield, so he stand should be cut whether there is enough growth to justify forage harvest or not. Producers should scout again 5-7 days after cutting to see if the population has fallen below threshold. If not, an insecticide may be warranted; more information is available in OMAFRA Publication 812: Field Crop Protection Guide.
Annual forages to increase inventory
As winter wheat harvest wraps up, there are opportunities to plant annual forage crops. Research from the University of Guelph suggests that 80 kg/ha of oats with 50 kg/ha of N provided higher silage yields than barley in southern Ontario. Oats are susceptible to rust, so producers should scout and use a fungicide if warranted. Other spring cereal species can be grown as fall forage. The difference in quality between species is very small.
Winter cereals can fill the forage gap in early spring. Tom Kilcer’s work in New York suggests that the optimal planting date for fall rye or winter triticale forage is 10-14 days before the optimal planting date for winter wheat as grain (Figure 2). Some early-planted soybeans are maturing early this year, which may provide an opportunity to sow winter cereals on time to maximize forage yields next spring. Seed winter cereals at 100-125 kg/ha and apply 50-75 kg N/ha at green-up in the spring.

July 27 to August 2, 2020 Weather Summary
| Location | Temp high °C | Temp low °C | Rain (mm) | Total Rain (mm)* | GDD (Base 0°C)* | GDD (Base 5°C)* | CHU* |
|---|---|---|---|---|---|---|---|
| Harrow (2020) | 30.5 | 14.2 | 11.8 | 296.1 | 1962.85 | 1375.6 | 2080.4964 |
| Harrow (2019) | 31 | 12.5 | 5.6 | 365.8 | 1932.25 | 1338.25 | 1961.3874 |
| Ridgetown (2020) | 30.9 | 14.2 | 33.4 | 282.8 | 1883.45 | 1299.7 | 1961.2776 |
| Ridgetown (2019) | 29.7 | 11 | 96.9 | 442.4 | 1833.3 | 1241.2 | 1852.5984 |
| London (2020) | 30.4 | 14.8 | 80.4 | 307.4 | 1821.15 | 1245.95 | 1878.06072 |
| London (2019) | 28.9 | 11.3 | 15.3 | 417.8 | 1742.55 | 1172.15 | 1778.67096 |
| Brantford (2020) | 32.4 | 14.9 | 13.5 | 200.7 | 1844.55 | 1266.4 | 1865.38764 |
| Brantford (2019) | 31.6 | 11.5 | N/A | 273.6 | 1807.6 | 1223.2 | 1838.27124 |
| Welland (2020) | 30.5 | 15.1 | 12.1 | 266.6 | 1863.4 | 1287.35 | 1959.64416 |
| Welland (2019) | 30.2 | 14.5 | 28.5 | 343.4 | 1871.8 | 1272.15 | 1926.00756 |
| Elora (2020) | 28.9 | 12 | 36.1 | 258.4 | 1702.95 | 1137.65 | 1749.62184 |
| Elora (2019) | 29.4 | 11.7 | 6.5 | 349.2 | 1409.5 | 889.85 | 1398.648 |
| Mount Forest (2020) | 28 | 12.4 | 68.6 | 374 | 1680.25 | 1125.65 | 1756.3206 |
| Mount Forest (2019) | 29.1 | 8.9 | N/A | 129.4 | 1636.85 | 1064.25 | 1680.08052 |
| Uxbridge (2020) | 31.2 | 12.7 | 56.9 | 239.7 | 1725.1 | 1169.6 | 1802.72256 |
| Uxbridge (2019) | 29.8 | 9.4 | N/A | 226.9 | 1629.7 | 1051.35 | 1647.34488 |
| Peter-borough (2020) | 31.2 | 11.4 | 27.4 | 189.9 | 1749.75 | 1171.8 | 1780.60164 |
| Peter-borough (2019) | 30.2 | 8.3 | 6.6 | 320.6 | 1671.7 | 1083.3 | 1645.8318 |
| Trenton (2020) | 30 | 14.7 | 30.5 | 252.4 | 1821.5 | 1237.65 | 1914.4266 |
| Trenton (2019) | 29.7 | 11.7 | 4.4 | 319.7 | 1811.5 | 1209.35 | 1845.75444 |
| Kemptville (2020) | 32.5 | 13.7 | 34.6 | 199.3 | 1874.25 | 1278.7 | 1916.10648 |
| Kemptville (2019) | 31.7 | 9.8 | N/A | 203.3 | 1722.35 | 1138.95 | 1709.65212 |
| Earlton (2020) | 30.1 | 10.9 | 29.5 | 307.2 | 1588.7 | 1048.6 | 1667.37768 |
| Earlton (2019) | 29.2 | 7.9 | 12.1 | 321.1 | 1398.05 | 877.4 | 1426.92 |
| Sudbury (2020) | 28.3 | 12.3 | 20 | 353.4 | 1602.75 | 1056.6 | 1682.64732 |
| Sudbury (2019) | 27.8 | 9.4 | 21 | 322.2 | 1376.65 | 871.3 | 1409.06592 |
| Thunder Bay (2020) | 28.3 | 8.9 | 15 | 156.1 | 1489.5 | 942.15 | 1514.82804 |
| Thunder Bay (2019) | 28.5 | 7.1 | 19.6 | 260.6 | 1326.45 | 803.6 | 1305.3078 |
| Fort Francis (2020) | 28.8 | 7.5 | 1 | 200.9 | 1617.4 | 1052.55 | 1663.61532 |
| Fort Francis (2019) | 30 | 3.6 | 12 | 271.1 | 1436.2 | 887.9 | 1420.27224 |
* Rainfall and Growing Degree Days (GDD) totals tallied since April 1. Crop Heat Unit (CHU) totals tallied from May 1