Take the Test – Beat SCN
Soybean harvest has begun, and many growers have asked if they could sample for soybean cyst nematode this fall. For many growers, managing soybean cyst nematode (SCN) means planting SCN resistance varieties BUT effective SCN management does not end when you have selected your soybean varieties! It is imperative to not only know your SCN population levels in each of your fields but what is happening to those levels over time and it begins with SCN soil testing!
If your SCN is decreasing, this could indicate your management program is working. If your is SCN rising, this is a big red flag that the problem is getting worse and could get out of hand, costing you significantly in lost yields, dollars and sleep! If you do not know what is happening to your SCN population levels in your fields over time, your efforts may be wasted. One of the most important decisions a producer can make concerning this devastating pest is to take a SCN soil test.

The fall is a perfect time to sample harvested soybean fields or those which will be planted to soybeans in 2021. Sampling for SCN after or at harvest provides a perfect opportunity to “take the test” since it is typically a time when soil samples are taken to determine next year’s fertilizer program. It is as simple as taking a few more soil cores from the field, mix them together, split the sample and send in half for your fertilizer recommendations and the other half for a SCN analysis. Fall sampling also helps identify poor yielding fields or areas within the field that need sampling while they are fresh in your mind. A fall sample takes into account any significant SCN population changes that have occurred during the growing season.
Remember, the results of the test are only as good as the soil sampling technique. Therefore, it is necessary to obtain a soil sample that is representative of the field. Ideally the numbers of acres in any one sample should not exceed 20 to 25 acres. The fewer acres a sample represents the more accurate the results will be. Having said that, one large field sample (50-100 acres) is better than no sample at all. Make sure to clearly mark that the samples are for a SCN test and they can be sent to any of the SCN testing labs in the province (OMAFRA Agronomy Guide Publication 811 – Appendix E, page 413).

Table 16-1. Potential Risk of Yield Loss for various SCN population levels (based on soil test results).When you get your test back what does it mean? First it lets you know if you have SCN and what the potential yield loss risk is for the field based on the SCN population levels (Table 16.1). If you get a “Not Detected” result this means SCN is not present, is below detectable levels or as often is the case SCN levels are variable in the field and these pockets where not captured in the sampling pattern. It does mean you should continue to monitor these fields since SCN levels can change rapidly. Anything below 1,000 eggs/ 100 gm of soil is considered low risk with a potential yield loss for susceptible varieties ranging from 0-20% and a resistant variety should be grown or rotate to a non-host crop (corn/wheat). Moderate to high risk fields (1,000 to 10,000 eggs/100 gm soil) potential yield losses range from 20-50% and SCN resistant varieties will likely be impacted especially those containing the PI88788 source of resistance. Fields with over 10,000 eggs/100 gram of soil should be rotated to non-host crops for two years and then sampled again to determine if populations have declined sufficiently for soybeans. A susceptible variety will see significant yield losses as well as those containing the adapted PI88788 population (SCN Type 2).
Although SCN cannot be eliminated it can be beaten. The first step is identification, so get out there and sample. TAKE THE TEST AND BEAT THE PEST! KNOW YOUR NUMBER!
For more information please visit the SCN Coalition website at www.thescncoalition.com or OMAFRA Agronomy Guide Publication 811 at www.omafra.gov.on.ca/english/crops/pub811/p811toc.html).
Will My Corn Mature Prior to a Killing Frost (-2°C or lower)?
How much time can we expect to have before a killing frost? We can only estimate our risk based on long-term weather normals. (Table 1)
Table 1. Long term average season end dates for 4 locations in Ontario.
| Location | Average Season End Date |
| Elora | September 26 |
| Ottawa | September 29 |
| Exeter | October 3 |
| Ridgetown | October 10 |
General guidelines for time to maturity from various grain fill stages for early May planting dates is presented in Table 2.
Table 2. Expected weeks to maturity, yield and grain quality risks for frost received at various grain fill stages.
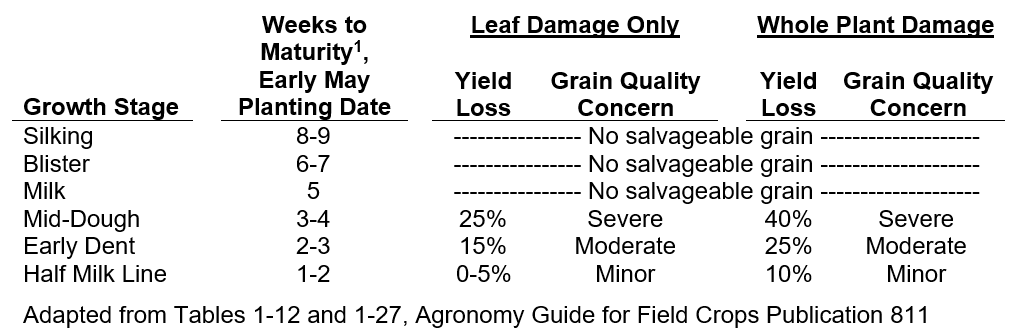
1 – general guidelines for a 2800 CHU hybrid, may differ slightly across hybrids, hybrid maturities or planting dates. Weeks to maturity will take longer as pollination/grain fill is pushed later into the season to days with lower CHU accumulations.
What is the impact of not maturing prior to a frost?
The impact of not reaching physiological maturity (black layer) before a frost depends on corn stage and frost temperature and duration. A light frost (not less than -2°C) will likely damage leaves and halt any further photosynthesis but not penetrate stem tissues. This will stop dry matter accumulation in the plant, but still allow translocation within the plant to continue some grain fill. A frost of -2°C or lower is generally considered a killing frost, where stem tissue is damaged, stopping any further dry matter accumulation and translocation.
Frost prior to dent stage (approx. 3 weeks until maturity) would have severe impacts on yield and grain quality. Getting a corn crop to at least half-milk stage (approx. 1-2 weeks until maturity) prior to frost removes considerable yield and grain quality risks (Table 2). Cool night temperatures (<10°C) has been shown to temporarily impair photosynthetic rates and take a day or two for plants to recover to full capacity. This can lengthen estimated time to maturity given in Table 2.
References:
Brown, C. Editor. 2017. Pub 811 OMAFRA Agronomy Guide for Field Crops. Ontario Ministry of Agriculture, Food and Rural Affairs.
DuPont Pioneer. 2015. Corn Growth and Development. DuPont Pioneer.
Mark Your Calendars!
Ontario Virtual Diagnostic Days (Fieldcropnews.com)
Episode # 6 on corn fungicides and sprayer applications including aerial vs ground will be available September 23, 2020. Go to Fieldcropnews.com to watch it as well as the other previous 5 episodes. All episodes can be viewed without registering any time. Certified Crop Advisors will be able to collect 8 CEU by registering for the event.
Ontario Agricultural Conference (OAgC)
The Southwest Agricultural Conference together with the Guelph and the Eastern Ontario Crop Conferences will be offering a combined “CANNOT MISS!” Ontario Agricultural Conference on January 6th & 7th, 2021.
Teams have “Come Together” and assembled an incredible line up of world-class speakers. The OAgC will showcase over 30 agricultural live, interactive sessions on each of the conference dates, along with multiple on-demand recorded sessions and provide attendees with the tremendous knowledge and experience they expect and do not want to miss. A virtual exhibit hall will allow attendees to engage with conference sponsors, who are a critical part of our success. Attendees can join live sessions, ask questions, and hear the latest from agricultural experts on current topics. Then they can set their own schedule to view on-demand sessions, beginning on January 6th, and continue learning all winter long.
Weather Data Summary
| Location | Temp high °C | Temp low °C | Rain (mm) | Total Rain (mm)* | GDD (Base 0°C)* | GDD (Base 5°C)* | CHU* |
| Harrow (2020) | 25 | 11 | 33 | 389 | 2843 | 2046 | 3156 |
| Harrow (2019) | 24 | 9 | 42 | 432 | 2728 | 1934 | 2984 |
| Ridgetown (2020) | 25 | 8 | 30 | 465 | 2643 | 1858 | 2868 |
| Ridgetown (2019) | 25 | 8 | 24 | 290 | 2687 | 1898 | 2862 |
| London (2020) | 25 | 8 | 30 | 305 | 2578 | 1822 | 2827 |
| London (2019) | 24 | 7 | 17 | 329 | 2339 | 1594 | 2498 |
| Brantford (2020) | 22 | 8 | 36 | 447 | 2312 | 1578 | 2506 |
| Brantford (2019) | 23 | 6 | 12 | 301 | 2372 | 1637 | 2570 |
| Welland (2020) | 25 | 2 | 26 | 269 | 2384 | 1626 | 2509 |
| Welland (2019) | 24 | 7 | 17 | 314 | 2506 | 1742 | 2747 |
| Elora (2020) | 25 | 3 | 8 | 360 | 2539 | 1763 | 2707 |
| Elora (2019) | 22 | 3 | 26 | 378 | 2156 | 1436 | 2303 |
| Mount Forest (2020) | 19 | 3 | 28 | 483 | 2173 | 1447 | 2328 |
| Mount Forest (2019) | 21 | -2 | 2 | 282 | 2027 | 1299 | 2117 |
| Uxbridge (2020) | 20 | -3 | 8 | 332 | 2157 | 1412 | 2276 |
| Uxbridge (2019) | 25 | 11 | 33 | 389 | 2843 | 2046 | 3156 |
| Peter-borough (2020) | 24 | 9 | 42 | 432 | 2728 | 1934 | 2984 |
| Peter-borough (2019) | 25 | 8 | 30 | 465 | 2643 | 1858 | 2868 |
| Trenton (2020) | 25 | 8 | 24 | 290 | 2687 | 1898 | 2862 |
| Trenton (2019) | 25 | 8 | 30 | 305 | 2578 | 1822 | 2827 |
| Kemptville (2020) | 24 | 7 | 17 | 329 | 2339 | 1594 | 2498 |
| Kemptville (2019) | 22 | 8 | 36 | 447 | 2312 | 1578 | 2506 |
| Earlton (2020) | 23 | 6 | 12 | 301 | 2372 | 1637 | 2570 |
| Earlton (2019) | 25 | 2 | 26 | 269 | 2384 | 1626 | 2509 |
| Sudbury (2020) | 24 | 7 | 17 | 314 | 2506 | 1742 | 2747 |
| Sudbury (2019) | 25 | 3 | 8 | 360 | 2539 | 1763 | 2707 |
| Thunder Bay (2020) | 22 | 3 | 26 | 378 | 2156 | 1436 | 2303 |
| Thunder Bay (2019) | 19 | 3 | 28 | 483 | 2173 | 1447 | 2328 |
| Fort Francis (2020) | 21 | -2 | 2 | 282 | 2027 | 1299 | 2117 |
| Fort Francis (2019) | 20 | -3 | 8 | 332 | 2157 | 1412 | 2276 |
Comments are closed.