Acreage of dry beans increased approximately 20% over 2019, and 50% over 2018. Total acreage of dry beans insured by Agricorp in 2020 was 157,610 acres (Table 1). There were more acres of all market classes compared to last year, except for cranberry beans.
Table 1. Acres of dry edible beans insured by Agricorp in 2019 and 2020
| Dry Bean Market Class | 2019 Insured Acres | 2020 Insured Acres |
| White Beans | 61,517 | 75,548 |
| Black Beans | 10,566 | 17,372 |
| Cranberry Beans | 12,728 | 11,130 |
| Kidney Beans | 16,760 | 21,560 |
| Japan/Other Beans | 9,046 | 10,670 |
| Adzuki Beans | 19,445 | 21,283 |
| Total | 130,062 | 157,563 |
Dry bean planting started early, and by the end of May most adzuki acres and about 20% of other dry bean acres were planted. Cool temperatures and thunderstorms forecasted for early June briefly slowed progress, and planting was wrapped up by mid-June. Crusting of soils prior to emergence was an issue in many fields and producers were observed breaking up crust.
There was an increase in herbicide injury observations this season. The wet spring of 2019 delayed herbicide applications in corn, which translated to Group 27 herbicide carry-over injury in dry beans this spring. Bleaching of new trifoliates was observed in numerous dry bean fields. Injury was often worse in fields or areas of fields where beans were subject to additional stresses such as compaction and root rot caused by wet soils. Herbicide carry over symptoms are usually highly variable across the field and can be worse in areas of spray overlaps, on headlands, and where herbicide breakdown is slow. There were a few days of cool temperatures after planting which may have caused additional plant stress and increased the risk of herbicide injury. There were also reports of dry bean injury caused by pre-emergence Group 15 herbicide applications and some fields were replanted.
Diseases and Insects
Cool temperatures and slow growth early in the season contributed to fusarium root rot in some fields. Fusarium was also observed in fields that had herbicide carry over injury. June and July were relatively dry and hot, resulting in fewer disease issues. Bacterial wilt is not a common disease but was observed in low levels in June. It is typically seed borne and more common in hot (over 30°C), moist conditions. Risk of white mould was low during early flowering because conditions were dry and hot, but rainfall through the end of the flowering window resulted in white mould in some fields with lush growth.
In a survey for soybean cyst nematode (SCN) in Perth and Oxford Counties, 25 dry bean fields sampled in May and June tested negative for SCN. One additional dry bean field in Perth tested later in the season was positive for SCN, and one field of dry peas with a known history of SCN also tested positive. While many dry bean fields in Perth and Oxford do not yet have SCN, the pest is present in the region. All dry bean growers should be aware of the risk of SCN in dry beans and test soils to monitor for the pest.
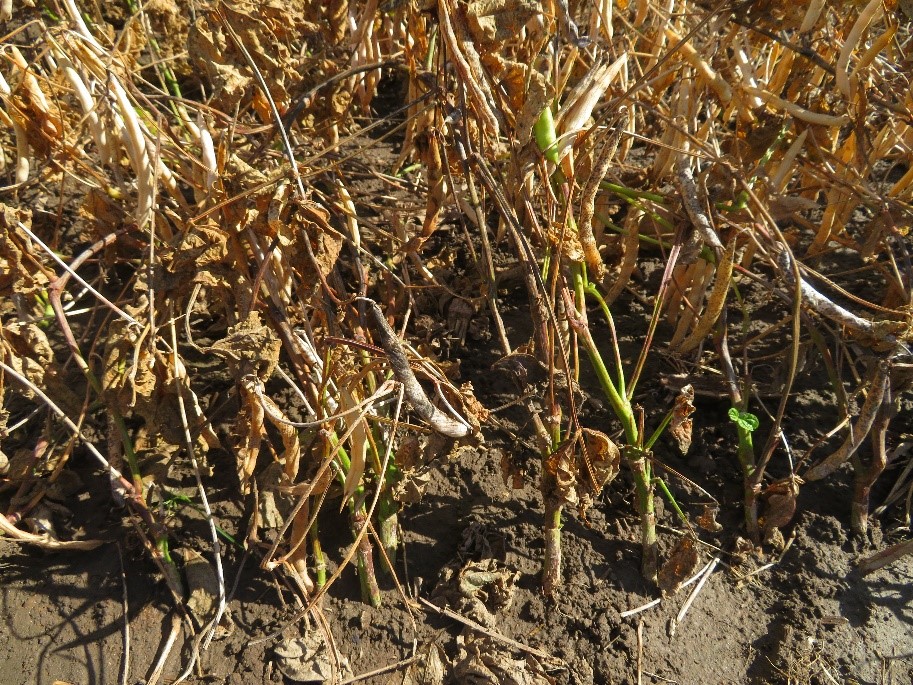
Potato leafhopper were present in some dry bean fields and warranted insecticide application. Levels of leafhopper were higher than last year, but not significantly greater than what is typically observed in Ontario beans. Two-spotted spider mites, which are more prevalent in hot and dry conditions, were reported in many regions this year. Spider mites are a pest of both soybeans and dry beans and require the same scouting and management practices for both crops. Significant spider mite damage was reported in many fields and some producers sprayed twice to control the insects (Figure 1).

The number of western bean cutworm (WBC) caught in pheromone traps was much higher in 2020 than in 2019. Averaged across the province, peak flight occurred the week of August 7th, which is a week later than the timing of peak flight in 2019. There were also higher numbers of WBC moths caught on dry bean fields than on corn fields in Ontario this year. Most dry beans are grown in regions where trap counts exceed 150 moths total, putting dry bean acres at risk of damage. Producers are encouraged to continue to trap moths on their fields so that insecticide applications can be targeted for 10 to 20 days after peak flight. Producers are also encouraged to scout for pod feeding late in the season in both sprayed and unsprayed fields to gain a better understanding of the level of damage WBC have caused.
Green patch syndrome, also called “crazy beans” by some producers, was observed again in 2020. Symptoms include plants staying green and leafy late in the season, even after pre-harvest herbicide application, but most importantly all the beans produced on affected plants are deformed. Investigations into the cause of these symptoms is ongoing and so far, all disease and virus tests have come back negative. Producers frequently observe these symptoms on a few plants, but some fields have large areas that are affected. Symptoms are frequently observed on cranberry beans but have also be found in kidney, otebo and white beans.
Harvest and Yield
Harvest began in early September and most beans were harvested in good conditions in September. There was frost in September in many regions which terminated some fields early, but most dry bean fields were mature prior to frost. Frost may have less of an impact on large weed plants in the field than it does on dry bean plants, so there can still be value in applying pre-harvest herbicides after frost.
Producers reported challenges with green stems at harvest time (unrelated to “green patch syndrome”, see Figure 2). Some varieties are more prone to green stems. Best practices for pre-harvest Eragon application include spraying when plants are fully mature and have started dropping leaves, spraying during sunny conditions between 8:00 AM and 5:00 PM, using water volumes of 25 gal/ac, driving slow with the boom low, and using water with pH above 6.5. Eragon is a systemic herbicide and is not as fast acting as true desiccants that are sometimes used on dry beans grown for seed production (e.g. Reglone). Plants may not fully dry down until 10 days or more after application.
Many producers reported that moisture at harvest was low, and there were challenges with splitting of large-seeded beans. Yields have been variable, with some growers reporting strong yields and others seeing yield or quality reductions from dry conditions in summer and early frost this fall. Final yield must be reported to Agricorp by December 15th, so yield data is not yet available for insured acres.
Events
The Southwest Agricultural Conference, Eastern Ontario Crop Conference, Golden Horseshoe and Heartland Soil and Crop Improvement Associations are pleased to present the first ever Virtual ONTARIO Agricultural CONFERENCE on January 6th and 7th, 2021! Under the theme of “Coming Together”, this combined team of conference specialists has asswembled an incredible array of 40 live streamed and ON DEMAND recorded sessions along with an Exhibition Hall packed with keen and knowledgeable conference sponsors as well as make sure to join us at the “Coming Together” Social Hour!
Conference registration is NOW OPEN so visit www.ONTARIOAgCONFERENCE.ca for program, ongoing updates, registration and conference information, or check-out the conference brochure in your November 3rd edition of the Ontario Farmer.
This is a conference you simply cannot afford to miss. So, mark January 6th & 7th, 2021 in your calendar now! See you there!
Weather Summary
| Location | Temp high °C | Temp low °C | Rain (mm) | Total Rain (mm)* | GDD (Base °C)* | GDD (Base °C)* | CHU* |
| Harrow (2020) |
16 |
-5 | 25 | 524 | 3606 | 2474 | 3871 |
| Harrow (2019) | 10 | -8 | 1 | 645 | 3568 | 2464 | 3813 |
| Ridgetown (2020) | 17 | -4 | 21 | 547 | 3459 | 2335 | 3672 |
| Ridgetown (2019) | 10 | -9 | 2 | 721 | 3355 | 2263 | 3548 |
| London (2020) | 16 | -4 | 15 | 611 | 3322 | 2217 | 3473 |
| London (2019) | 10 | -10 | 4 | 740 | 3170 | 2114 | 3338 |
| Brantford (2020) | 15 | -5 | 11 | 419 | 3365 | 2256 | 3469 |
| Brantford (2019) | 10 | -10 | N/A | 274 | 3228 | 2165 | 3379 |
| Welland (2020) | 15 | -4 | 23 | 436 | 3317 | 2231 | 3509 |
| Welland (2019) | 10 | -8 | 2 | 613 | 3344 | 2248 | 3552 |
| Elora (2020) | 15 | -6 | 12 | 461 | 2931 | 1880 | 2986 |
| Elora (2019) | 9 | -12 | 10 | 640 | 2635 | 1651 | 2676 |
| Mount Forest (2020) | 14 | -7 | 8 | 596 | 2917 | 1877 | 3004 |
| Mount Forest (2019) | 9 | -13 | N/A | 129 | 2926 | 1880 | 3040 |
| Uxbridge (2020) | 16 | -8 | 20 | 420 | 2984 | 1941 | 3085 |
| Uxbridge (2019) | 8 | -15 | N/A | 227 | 2924 | 1864 | 2997 |
| Peter-borough (2020) | 17 | -9 | 16 | 384 | 2974 | 1902 | 3026 |
| Peter-borough (2019) | 9 | -14 | 3 | 535 | 2895 | 1824 | 2918 |
| Trenton (2020) | 14 | -8 | 23 | 448 | 3158 | 2070 | 3309 |
| Trenton (2019) | 10 | -13 | 3 | 614 | 3223 | 2117 | 3370 |
| Kemptville (2020) | 16 | -9 | 20 | 498 | 3160 | 2078 | 3264 |
| Kemptville (2019) | 8 | -19 | N/A | 203 | 3038 | 1967 | 3097 |
| Earlton (2020) | 8 | -12 | 4 | 538 | 2575 | 1604 | 2620 |
| Earlton (2019) | 3 | -25 | 9 | 551 | 2377 | 1441 | 2389 |
| Sudbury (2020) | 9 | -11 | 3 | 693 | 2612 | 1627 | 2656 |
| Sudbury (2019) | 3 | -19 | 12 | 689 | 2434 | 1516 | 2498 |
| Thunder Bay (2020) | 8 | -15 | 2 | 388 | 2425 | 1468 | 2432 |
| Thunder Bay (2019) | 5 | -15 | 23 | 540 | 2313 | 1372 | 2266 |
| Fort Francis (2020) | 5 | -13 | 3 | 431 | 2541 | 1588 | 2614 |
| Fort Francis (2019) | 6 | -11 | 10 | 718 | 2481 | 1512 | 2452 |