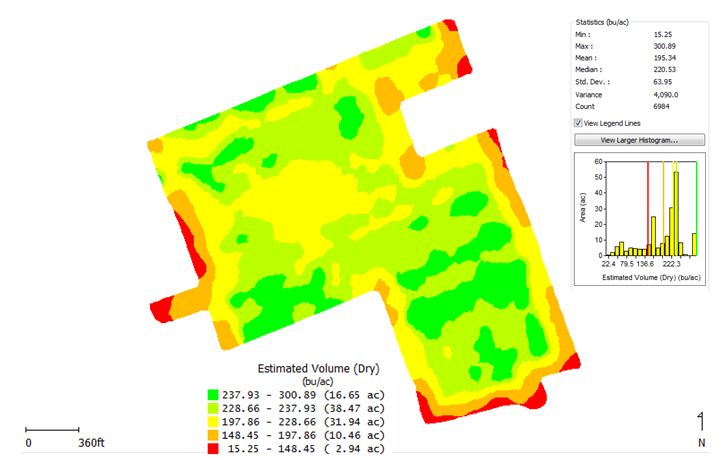
Graphique des données recueillies par capteur de rendement avec un logiciel SIG gratuit
Quelle est la densité de peuplement optimale pour le maïs? Est-ce que les différences de rendement associées à un labour primaire du sol compensent les coûts comparativement à une réduction du travail du sol? Est-ce que l’additif recommandé par le vendeur contribue à augmenter les rendements de la ferme? On dit qu’on ne peut pas connaître ce qu’on ne mesure pas. Il existe de nombreux outils pour extraire les données de récolte recueillies par le capteur de rendement à partir d’essais à la ferme. Dans certains cas, il faut payer pour un logiciel ou une application, des mises à jour ou des abonnements. Il existe aussi de nombreux services à forfait. Si vous avez déjà accès à un logiciel ou à des services pour exécuter ces tâches, ou si vous planifiez faire de nombreuses comparaisons, il s’agit probablement du meilleur choix et du plus rapide.
Si vous disposez de données que vous aimeriez analyser vous-même, que vous n’avez pas le logiciel pour le faire et que vous n’avez pas peur d’en découvrir un nouveau, vous trouverez dans le présent article un outil gratuit qui analysera les données du capteur de rendement recueillies sur des parcelles. Si une image vaut mille mots, une vidéo en vaut au moins un million. J’ai donc réalisé des vidéos qui montrent le processus, étape par étape, et qui durent 40 minutes en tout.
Étape 1 : Télécharger QGIS
QGIS est probablement la norme dans le domaine en ce qui a trait aux programmes SIG gratuits et de libre- accès. Le QGIS peut lire les données spatiales (comme la couche de données du capteur de rendement), permet de créer de nouvelles couches de données spatiales (parcelles) et effectue des analyses de couches de données (comme les rendements moyens à l’intérieur des parcelles) et bien d’autres choses. On peut y avoir accès gratuitement à www.qgis.org/en/site/.
L’outil a l’avantage d’être gratuit et d’être assorti d’une vaste documentation ainsi que de nombreux forums et vidéos permettant de trouver des réponses à vos questions. Les huit étapes du processus peuvent être comprises sans expérience antérieure avec le QGIS, ni un après-midi de lecture de messages sur les forums ou de recherches de vidéos YouTube sur Internet. Il a cependant le désavantage de ne pas pouvoir lire les données du capteur directement (il doit d’abord être converti en format de fichier SHP pour SIG), il n’est pas aussi rapide que d’autres logiciels ou applications (certains de ces logiciels peuvent effectuer ces analyses par quelques balayages du doigt sur un cellulaire ou une tablette) et n’exécute peut-être pas toutes les fonctions haut de gamme d’un logiciel SIG.
Je l’ai trouvé utile pour résumer les données de rendement quand on n’a pas accès au logiciel utilisé habituellement (en raison du confinement) ou lorsqu’on travaille avec des collègues qui souhaiteraient résumer les données de leurs essais, mais qui n’ont pas le logiciel pour le faire.
Ces étapes seront décrites plus en détail dans une série de vidéos dont les liens sont fournis avec cet article. Chaque vidéo dure environ 5 minutes.
Étape 2 : Lecture du fichier SHP du capteur de rendement
La première étape pour résumer les données du capteur de rendement est de lire le fichier SHP du capteur de rendement avec QGIS. Il faut pour cela extraire les données du capteur, les télécharger dans le logiciel du capteur (ou dans un autre programme qui peut lire le format du fichier) et exporter les données des différents champs sous forme de fichiers SHP pour les faire analyser dans le QGIS.
Étape 3 : Entrer les chemins QGIS ou les données de représentation
Il est possible que le téléchargement du QGIS ne vienne qu’avec un accès ouvert à un affichage Street View. Ce n’est pas indispensable, mais je préfère utiliser un arrière-plan qui fournit des images ou le nom des rues. Cette vidéo démontre comment télécharger des images en arrière-plan, dans ce cas il s’agit de l’imagerie de Google map.
Étape 4 : Visualiser les données selon l’emplacement
J’aime visualiser les données et savoir ce que je regarde, pour observer les tendances générales dans un champ et offrir ainsi un certain contrôle de qualité ou détecter les anomalies en regardant les couches de données. Cette vidéo décrit comment attribuer des codes de couleur dans la couche de données du capteur de rendement selon les valeurs de rendement dans le QGIS.
Étape 5 : Ajouter le plug-in numérique au QGIS
Certaines directives doivent être suivies pour savoir quels passages de machinerie correspondent à quelles parcelles d’essai. Si vous avez les coordonnées GPS de piquets ou des limites des parcelles (à partir du cellulaire), l’activation de ce plug-in vous permet d’entrer manuellement les nouveaux points et les coordonnées GPS dans le QGIS.
Étape 6 : Ajouter les piquets ou les limites des parcelles
L’affichage de marqueurs des limites de parcelles est utile pour aligner les passages de machinerie et créer des limites de parcelles et les étiqueter. Cette vidéo décrit comment créer des points de repère pour les piquets ou les limites de parcelles dans le QGIS, comment modifier leur apparence et afficher les étiquettes correspondantes.
Étape 7: Ajouter des polygones de parcelles et les nommer
Une fois que l’on sait le nombre de passages de machinerie qui correspond à telle parcelle, il faut délimiter la surface de chaque parcelle. Cette vidéo décrit comment créer et copier des polygones pour chaque parcelle et comment nommer chaque polygone afin de tenir compte du traitement utilisé dans la parcelle et faciliter ainsi le résumé des données dans le QGIS.
Étape 8 : Valeurs moyennes du capteur de rendement dans les polygones
Cette vidéo montre comme résumer les données des parcelles dans le QGIS en reliant les points du capteur de rendement à l’intérieur de chaque parcelle au polygone qui délimite la parcelle. Une fois que ces points sont reliés, on peut sauvegarder ces données sous forme d’une nouvelle couche et créer un tableau qui résume les valeurs saisies par le capteur de rendement qui ont été résumées pour chaque parcelle.
Conclusion
Bien que l’exemple donné ci-dessus porte sur une parcelle et un résumé en particulier des données du capteur de rendement de la moissonneuse, le QGIS est suffisamment générique pour créer des couches de données ou analyser ou résumer des données provenant de différentes applications spatiales ou sources. Ce qui précède n’était qu’un exemple servant à illustrer les possibilités de l’outil proposé.
~~~
What’s my optimum corn population? Does the yield response for primary tillage cover its costs compared to reduced tillage? Does the additive this salesperson is promoting provide a yield response on my farm? They say you don’t know what you don’t measure. Many options exist for extracting yield monitor harvest data from on-farm trials. Some require paying for software or apps, software or app upgrades or subscriptions. There are also many for-hire services that offer this. If you already have access to software or services that do this, or plan to do lots of comparisons, these are likely better or quicker options.
If you have data you would like to analyze yourself, don’t currently have software that does so, and aren’t afraid of new software, this article demonstrates a free option to analyze yield monitor data from plots. If a picture is worth 1,000 words, a video is worth at least 1,000,000. I’ve made step-by-step videos outlining the process, about 40 minutes total.
Step 1: Dowload QGIS
QGIS is likely the standard for free, open-access GIS (geographic information system) programs. QGIS can read in spatial data (e.g. yield monitor layer), allow you to create new spatial layers (e.g. plots) and do analysis of data layers (e.g. average yields within plots) among countless other things. It’s freely available at www.qgis.org/en/site/.
Pros include it is free and there is great open documentation, forums and videos to find solutions to your questions. These eight steps were entirely learned from no prior QGIS experience, and an afternoon of browsing forum posts and YouTube videos from internet searches. Cons include it cannot read monitor data directly (must be converted to GIS-standard SHP file format first), is not as quick as other software or apps (some can do these analysis with a couple swipes of a finger on a phone or tablet) and may not do everything high end GIS software can.
I’ve found this helpful for summarizing yield data when I don’t have access to software I would normally use (e.g. COVID lockdown) or working with colleagues who would like to summarize data from their trials but don’t have software to do so.
The steps will be further described in a series of videos that are linked within this article. Each video is approximately 5 minutes long.
Step 2: Read in Yield Monitor SHP File
The first step in summarizing yield monitor data is to read your yield monitor SHP file into QGIS. This requires pulling data from your combine monitor, uploading it to your monitor’s software program (or another that can read your monitor’s file format) and exporting data from individual fields as SHP files for analysis into QGIS.
Step 3: Source QGIS Roads and/or Imagery Layers
Your QGIS download may only come with open access street maps background. While not critical, I prefer using a background layer providing imagery or street names. This video demonstrates how to load an imagery background, in this case Google map’s satellite imagery layer, as a background.
Step 4: Visualize Points Data
I like to visualize data so I know what I am looking at, observe general trends across the field and to provide some quality control or outlier detection when looking at the data layer. This video outlines how to colour-code points in your yield monitor data layer by yield value in QGIS.
Step 5: Add QGIS Numerical Digitize Plugin
You will need some guidance as to which combine passes belong to which test plots. If you have GPS co-ordinates for pre-marked stakes or edges of plots (e.g. from cell phone), enabling this plugin allows you to manually enter new points and enter custom GPS coordinates in QGIS.
Step 6: Add Plot Stakes or Boundaries
Displaying plot markers is useful for lining up proper combine passes with plots, and properly creating and labelling plot boundaries. This video describes how to create points for plot stakes or boundaries in QGIS, adjust their appearance, and display labels for each one.
Step 7: Add and Name Plot Polygons
Once we know which combine passes line up with which plots, we need to outline the plot area over the yield monitor data for each plot. This video outlines how to create and copy polygons for each plot and name each polygon to reflect the plot or treatment underneath it for easy data summarization in QGIS.
Step 8: Average Yield Monitor Values Within Plot Polygons
This video shows how to summarize plot data in QGIS by joining yield monitor data points within each plot to the polygon delineating the plot. Once joined, we can save this as a new layer and create a summary table with yield monitor values summarized by each plot.
In Conclusion
While this example was specific to a plot stake, combine yield monitor data summary, QGIS is generic enough that it works for creating layers or analyzing or summarizing data from many different spatial applications or sources. This was merely one example to show possibility of what can be done.