Corn Stand Checkup
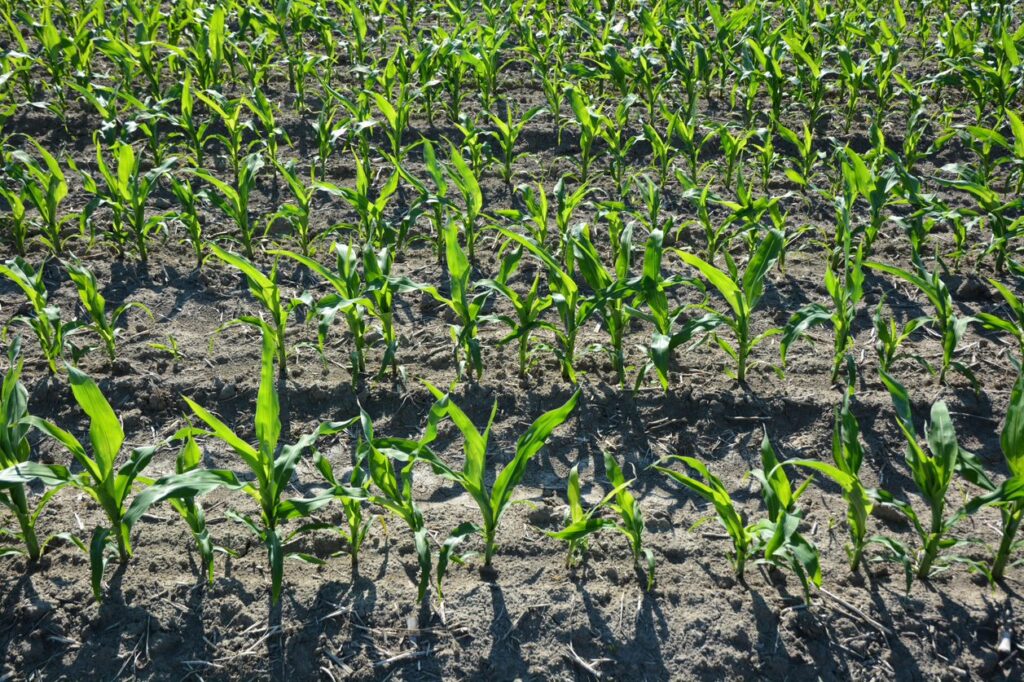
Scouting corn between emergence and knee high provides a report card on seedbed preparation, planter operation and agronomic practices affecting early plant establishment and growth. Causes of issues can often be identified at this stage to make improvements for following years.
Counting Plants
For easy math, a common method of measuring population is to measure 1/1000th of an acre of row length with a tape measure (Table 1.), count the number of plants within this row length for a couple rows either side of the tape, and multiply those numbers by 1000. This should be repeated many times across different areas of the field to give an idea of what the average and variability in population is.
Table 1. Row Length Required to Measure 1/1000th of an acre for various row widths
| Row Width (inches) |
Row Length for 1/1000th ac |
| 20 | 26’2″ |
| 22 | 23’9″ |
| 30 | 17’5″ |
| 36 | 14’6″ |
Population should be compared to expected seed drop. If there is significant deviation, this timing provides the opportunity to investigate why and determine if corrections could be made for future years. Gaps in the corn stand should serve as red flags to dig and investigate (Figure 1.) if issues are:
- Mechanical – Are seeds completely missing in gaps or are many double-placed seeds present, suggesting metering issues?
- Agronomic – Are seeds present in gaps, but there is a clear agronomic issue affecting emergence or growth that could be addressed? (lack of depth/moisture, poor seed to soil contact, fertilizer burn, soil pH, pest feeding)
- Environmental – Are seeds present in gaps, but there appears to be reduced emergence consistent with environmental conditions after planting? (poor vigour due to cold temperatures/fluctuations or rain, broken coleoptiles or leafing out underground, soil crusting). Environmental conditions may not be manageable, but follow-up observations may adjust risk tolerances for planting ahead of adverse weather or provide insight into hybrid tolerances for early season stress.

Counting Leaves
Uniform plant staging is critical to maximizing yield. Ontario research has shown having 1 in 6 plants with a 2-leaf delay in staging reduces yield 5% relative to uniform staging (Liu et al, 2004). Plants emerging late relative to neighbouring plants fail to catch up in growth and yield. Observe leaf stage of each plant during population counts. There are several leaf counting methods, but for this purpose method doesn’t matter as long as it is consistent.
Like gaps in the corn stand, plants that are delayed relative to neighbours should serve as red flags to dig and investigate for issues (Figure 2.). Many causes can be agronomic issues as described above. Shallow planting depth or poor seed zone moisture can be a common cause in dry years, but also look carefully for signs of other stresses which may slow germination or emergence of plants (fertilizer or low pH can cause root burn/loss, pest feeding or compaction can impair growth).

Checking Planting Depth
Checking population provides a good opportunity to dig and evaluate planting depth. Emerged plants makes this easier to check a large number of plants in row than just the seeds you find in the trench at planting. A couple things to consider:
- How does actual seed depth compare to what the planter operator thought they were placing seed at during planting? If they are consistently shallower or deeper, remember this for future years.
- How consistent is seed depth down a length of row, or different parts of the field? If uniform plant development is important, uniform planting depth will also be important. If not uniform, is there an obvious reason why, or things that should be checked on the planter before next year? (down pressure or ground contact, furrow formation, seed placement or residue in the furrow)
- Are the shallowest seeds acceptable from a soil moisture, germination and nodal root set perspective?
Checking Roots
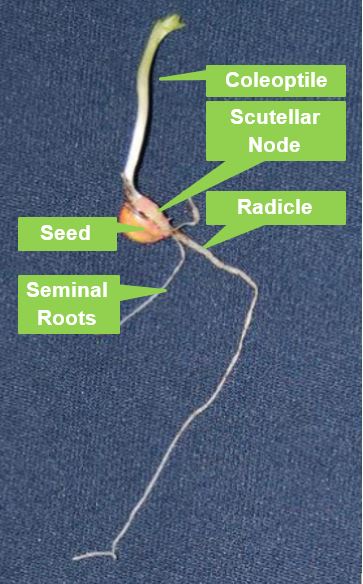
While digging, knowing corn seedling root structure is helpful for ruling in, or ruling out issues early on (fertilizer burn, low pH). Healthy corn seedling roots are not random – they should have a scutellar node which bursts from the side of the corn kernel at germination, from which a coleoptile (and eventually mesocotyl/shoot) emerges from the kernel dent end, and a radicle (primary seedling root) which emerges from the kernel tip end (Figure. 3). Additional seminal roots may also emerge from the scutellar node. If there has been root injury, look for missing, shortened or burnt/blackened radicle or seminal roots/tips. Unusual compensatory root growth coming from non-damaged areas such as the mesocotyl is another sign root injury has occurred.
Furrow Condition
Digging also provides an opportunity to evaluate furrow condition after planting. Is any smearing of furrow sidewalls or confined root growth evident? Was the furrow well closed, and not re-opened with soil drying? Where residue was present, was it well cleared from the row and not incorporated into the furrow to impact seed placement? Were residue cleaners not overly aggressive to the point they were trenching the soil, or moving soil with residual herbicides out of the corn row? In some years and soils, some of these may be challenging to avoid, but including these in a checkup will at least confirm if these issues are present.
References:
Liu, W., M. Tollenaar, G. Stewart and W. Deen. 2004. Response of Corn Grain Yield to Spatial and Temporal Variability in Emergence. Crop Sci. 44:847-854.
Weather Data
|
Location |
Year |
Weekly June 7 – 13 | Accumulated | ||||||
| Highest Temp (°C) | Lowest Temp (°C) | Rain (mm) | Rain (mm) April 1st | GDD 0C April 1st | GDD 5C April 1st | CHU May 1st | |||
| Harrow | 2021 | 28 | 13 | 6 | 130 | 934 | 598 | 715 | |
| 2020 | 31 | 9 | 9 | 169 | 860 | 521 | 756 | ||
| 2019 | 26 | 9 | 11 | 297 | 902 | 540 | 713 | ||
| Ridgetown | 2021 | 29 | 11 | 7 | 122 | 874 | 546 | 683 | |
| 2020 | 31 | 6 | 14 | 153 | 795 | 471 | 711 | ||
| 2019 | 25 | 8 | 26 | 252 | 818 | 468 | 630 | ||
| London | 2021 | 30 | 13 | 8 | 128 | 872 | 550 | 665 | |
| 2020 | 31 | 5 | 33 | 179 | 756 | 434 | 647 | ||
| 2019 | 27 | 8 | 21 | 264 | 763 | 429 | 607 | ||
| Brantford | 2021 | 31 | 13 | 5 | 120 | 852 | 527 | 649 | |
| 2020 | 32 | 5 | 21 | 144 | 750 | 434 | 638 | ||
| 2019 | 27 | 8 | 27 | 272 | 755 | 423 | 598 | ||
| Welland | 2021 | 30 | 15 | 3 | 85 | 846 | 517 | 632 | |
| 2020 | 31 | 8 | 4 | 141 | 778 | 455 | 666 | ||
| 2019 | 29 | 7 | 44 | 251 | 796 | 453 | 620 | ||
| Elora | 2021 | 29 | 12 | 3 | 97 | 775 | 460 | 583 | |
| 2020 | 31 | 5 | 32 | 131 | 682 | 385 | 579 | ||
| 2019 | 25 | 6 | 27 | 271 | 664 | 346 | 521 | ||
| Mount Forest | 2021 | 29 | 12 | 3 | 102 | 785 | 472 | 602 | |
| 2020 | 31 | 4 | 38 | 146 | 670 | 386 | 581 | ||
| 2019 | 25 | 7 | 129 | 651 | 341 | 513 | |||
| Peterborough | 2021 | 30 | 9 | 1 | 91 | 768 | 442 | 576 | |
| 2020 | 31 | 3 | 26 | 128 | 698 | 387 | 609 | ||
| 2019 | 27 | 4 | 34 | 273 | 680 | 352 | 521 | ||
| Kingston | 2021 | 30 | 11 | 0 | 94 | 786 | 460 | 564 | |
| 2020 | 24 | 4 | 5 | 168 | 752 | 424 | 639 | ||
| 2019 | 27 | 8 | 21 | 272 | 742 | 404 | 562 | ||
| Kemptville | 2021 | 32 | 10 | 0 | 98 | 875 | 543 | 651 | |
| 2020 | 30 | 4 | 2 | 126 | 712 | 394 | 613 | ||
| 2019 | 29 | 5 | 15 | 203 | 683 | 361 | 508 | ||
| Earlton | 2021 | 34 | 5 | 1 | 80 | 731 | 424 | 538 | |
| 2020 | 28 | 1 | 5 | 112 | 518 | 284 | 474 | ||
| 2019 | 30 | 4 | 85 | 270 | 459 | 206 | 366 | ||
| Sudbury | 2021 | 31 | 10 | 16 | 112 | 744 | 438 | 553 | |
| 2020 | 27 | 0 | 8 | 120 | 573 | 314 | 516 | ||
| 2019 | 28 | 7 | 65 | 248 | 472 | 215 | 356 | ||
| Thunder Bay | 2021 | 31 | 4 | 9 | 188 | 599 | 307 | 462 | |
| 2020 | 21 | 0 | 27 | 76 | 510 | 266 | 465 | ||
| 2019 | 26 | 2 | 8 | 147 | 428 | 172 | 329 | ||
| Fort Frances | 2021 | 32 | 4 | 22 | 136 | 663 | 364 | 568 | |
| 2020 | 28 | 2 | 53 | 112 | 600 | 333 | 552 | ||
| 2019 | 33 | 0 | 13 | 121 | 497 | 227 | 390 | ||
| Report compiled by OMAFRA using Environment Canada data. Data quality is verified but accuracy is not guaranteed. Report supplied for general information purposes only. An expanded report is available at www.fieldcropnews.com. | |||||||||