Soybean Update

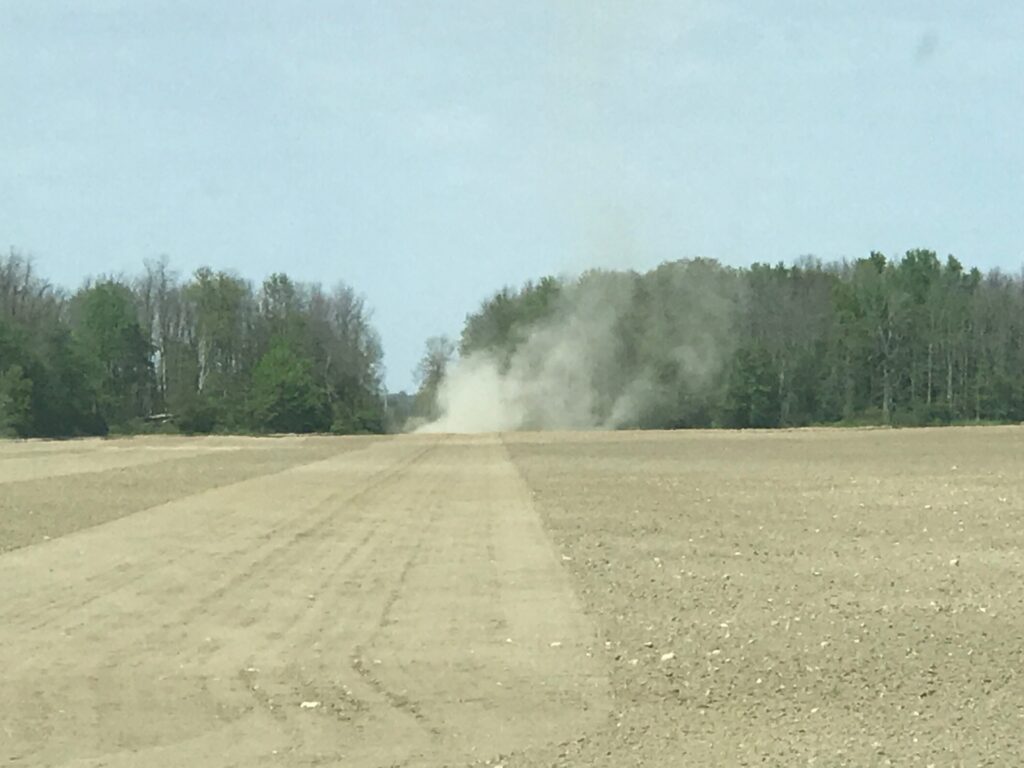
The majority of the soybean crop was planted by May 20th. Although plant stands have generally been good, there are fields with poor emergence. Poor soybean stands can be caused by various issues such as insect or slug feeding, but this year the main problem has been dry soil. Soybeans must be seeded about 0.5 inches into moisture, which under ideal conditions results in a total planting depth of about 1.5 inches. In many cases this season, fields had to be planted 2.0 to 2.5 inches to find adequate moisture. In some area’s moisture was not present even then. Planting soybeans deeper than 2.5 inches is generally not recommended, because the seed has limited energy reserves and cannot emerge from very deep planting. If seed was not placed into adequate soil moisture and begins to swell but then dries before emergence, it will die unless there is a rain within about 5-7 days (Figure 2.).

Frost Damage
Freezing temperatures in late May caused frost damage in northern counties and in low-lying fields in southern Ontario. Plants damaged below the cotyledons by early-season frost or hail will not recover. If frost damages the growing point of the seedling but not the stem portion below, the plant will send out new shoots from the base of the cotyledons. The only way to determine if the seedling is dead is to wait 5 days, and watch for new growth to emerge from the point where the cotyledons or leaves attach to the stem (leaf axils). Research trials have show that leaf loss at early growth stages has little impact on final yield or maturity. So if the plants survive, they still have excellent yield potential. Sometimes a light frost will actually increase yield because plants branch more.
Replants
Poor plant stands should be inspected carefully before making the decision to replant. Normal seeding rates include a margin of safety to ensure emergence of an adequate crop. Keeping an existing stand is often more profitable than replanting. The uniformity of the existing crop is more important than having a high population. Soybeans have an impressive ability to compensate for thin stands under good growing conditions. Soybean plants can fill spaces up to 30 cm (12 inches) within or between rows with relatively little yield reduction. Research has shown that a final stand of 90 000 plants per acre in 7.5-inch rows provides a yield potential of 90%. Plants must be healthy, evenly distributed and weed free for low populations to flourish. Field experience has shown that more plants per acre are needed on clay soils. A minimum stand of about 110 000 plants/acre on heavy clay soils is required to achieve good yields. Thickening a poor stand rarely improves final yield unless populations are below 90 000 plants per acre. If a poor stand must be thickened, use the same variety. These later planted seeds will usually mature within 7 to 10 days of the original stand even though they may have been seeded a month later in the spring.
Double Cropping Soybeans
A number of growers’ double crop soybeans after forage harvest in June, or after winter wheat harvest in July. The success of double cropping soybeans largely depends on having adequate moisture during the summer and having an open fall. When planting is delayed past the end of June, full season soybean varieties may not mature before a killing frost in the fall. To minimize this risk, shorter season varieties (approximately 1.0 maturity group) should be seeded when double cropping. Late planting shortens the vegetative growth period, resulting in smaller plants with pods closer to the ground. Choosing a taller variety, planting in narrow rows, and increasing the seeding rate will improve yields with late planted soybeans. Double cropping is usually unsuccessful if seeding cannot be completed by July 10th. It’s also important to recognize that by mid-July half the growing season is over. A realistic yield goal of 20-30 bu/ac is all that can be expected from double cropping, even if the growing season is perfect.
Weed Control
When deciding post-emergent herbicide timing, apply herbicides according to the leaf stage of the weeds. Smaller weeds are much more susceptible to herbicides. Waiting for the crop to reach the right stage may result in weeds growing past the optimum time for treatment. Weeds that emerge at the same time as the crop cause the greatest amount of competition and yield reduction. Later emerging weeds have much less of an impact on final yield. The critical weed free period for soybeans is from the first trifoliate to the third trifoliate leaf stages. In hot, humid weather soybean plants shut down and cannot metabolize herbicides quickly. Evening herbicide applications allows the crop to metabolize herbicide overnight during cooler temperatures and reduces herbicide stress.
Weather Data
| Location | Year | Weekly May 24-30 | Accumulated | ||||||
| Highest Temp (°C) | Lowest Temp (°C) | Rain (mm) | Rain (mm) April 1st | GDD 0C April 1st | GDD 5C April 1st | CHU May 1st | |||
| Harrow | 2021 | 29 | 5 | 28 | 102 | 708 | 426 | 434 | |
| 2020 | 30 | 9 | 12 | 156 | 589 | 320 | 433 | ||
| 2019 | 29 | 8 | 42 | 244 | 658 | 366 | 418 | ||
| Ridgetown | 2021 | 30 | 1 | 33 | 96 | 652 | 379 | 412 | |
| 2020 | 30 | 7 | 11 | 125 | 536 | 282 | 411 | ||
| 2019 | 31 | 6 | 28 | 215 | 605 | 320 | 378 | ||
| London | 2021 | 30 | 4 | 23 | 106 | 645 | 378 | 388 | |
| 2020 | 30 | 7 | 10 | 143 | 517 | 265 | 375 | ||
| 2019 | 29 | 8 | 40 | 225 | 538 | 273 | 345 | ||
| Brantford | 2021 | 32 | 3 | 18 | 100 | 624 | 354 | 378 | |
| 2020 | 31 | 5 | 11 | 117 | 502 | 257 | 356 | ||
| 2019 | 27 | 8 | 47 | 222 | 532 | 270 | 339 | ||
| Welland | 2021 | 28 | 3 | 18 | 71 | 634 | 360 | 375 | |
| 2020 | 32 | 7 | 21 | 131 | 531 | 279 | 379 | ||
| 2019 | 27 | 9 | 22 | 192 | 568 | 295 | 355 | ||
| Elora | 2021 | 30 | 1 | 14 | 84 | 562 | 301 | 328 | |
| 2020 | 31 | 5 | 15 | 95 | 454 | 227 | 323 | ||
| 2019 | 24 | 8 | 28 | 221 | 460 | 211 | 288 | ||
| Mount Forest | 2021 | 29 | 1 | 17 | 92 | 567 | 310 | 338 | |
| 2020 | 30 | 4 | 18 | 107 | 446 | 231 | 331 | ||
| 2019 | 22 | 6 | 129 | 444 | 205 | 281 | |||
| Peterborough | 2021 | 28 | -2 | 3 | 81 | 567 | 296 | 343 | |
| 2020 | 31 | 5 | 23 | 98 | 471 | 230 | 356 | ||
| 2019 | 23 | 6 | 22 | 212 | 485 | 227 | 311 | ||
| Kingston | 2021 | 25 | 2 | 0 | 82 | 587 | 316 | 326 | |
| 2020 | 29 | 5 | 18 | 145 | 516 | 258 | 365 | ||
| 2019 | 24 | 6 | 26 | 222 | 528 | 259 | 318 | ||
| Kemptville | 2021 | 28 | -1 | 0 | 79 | 654 | 377 | 388 | |
| 2020 | 34 | 5 | 13 | 111 | 495 | 248 | 368 | ||
| 2019 | 23 | 6 | 18 | 177 | 493 | 237 | 301 | ||
| Earlton | 2021 | 24 | -4 | 5 | 65 | 527 | 276 | 306 | |
| 2020 | 32 | 2 | 36 | 99 | 341 | 177 | 295 | ||
| 2019 | 21 | 3 | 2 | 178 | 286 | 103 | 190 | ||
| Sudbury | 2021 | 26 | 0 | 17 | 95 | 539 | 287 | 314 | |
| 2020 | 32 | 2 | 20 | 101 | 380 | 191 | 304 | ||
| 2019 | 21 | 5 | 13 | 182 | 319 | 122 | 205 | ||
| Thunder Bay | 2021 | 27 | -5 | 5 | 170 | 415 | 177 | 258 | |
| 2020 | 28 | 3 | 15 | 45 | 332 | 158 | 283 | ||
| 2019 | 23 | -2 | 4 | 107 | 288 | 92 | 183 | ||
| Fort Frances | 2021 | 27 | -5 | 3 | 113 | 461 | 217 | 349 | |
| 2020 | 27 | 1 | 17 | 55 | 388 | 192 | 314 | ||
| 2019 | 25 | -1 | 22 | 96 | 331 | 121 | 205 | ||
| Report compiled by OMAFRA using Environment Canada data. Data quality is verified but accuracy is not guaranteed. Report supplied for general information purposes only. An expanded report is available at www.fieldcropnews.com. | |||||||||