Corn Nitrogen Status
Nitrogen mineralization is favoured by warm soil temperatures with adequate soil moisture and aeration. Excess moisture can slow mineralization or increase the potential for losses through denitrification (especially under warm conditions) or leaching.
Spring of 2021 progressed similar to 2020. Sunshine and little rainfall resulted in great soil conditions through April and May. A period of cold temperatures dominated for a 1-2-week period early May, which was followed by seasonal to above seasonal temperatures. Variability in temperatures brought into question how N mineralization may be affected in 2021.
OMAFRA leads an annual Pre-Sidedress Nitrogen Test (PSNT) survey to gauge year-to-year levels across Ontario. From May 31 to June 2, 93 samples were collected across Ontario from a range of previous crops, soil textures and geographies. A V3-V4 stage is typically targeted for PSNT sampling but given the start of sidedressing and warm temperatures in the forecast, the survey was slightly ahead of schedule with most corn ranging V1-V3. Where corn fields without preplant N could not be found, soybean or processing vegetable fields were sampled if rotations were representative of grain corn (following wheat or soybeans).
The average PSNT value for the 2021 survey was 13 ppm. This is similar to 2020 (14 ppm) and slightly above the long-term average of 12 ppm (2011-2020) suggesting similar to slightly higher than normal mineralization by sidedress stage in 2021. For historical reference, these levels compare most to years 2012, 2018 and 2020. More information can be found at www.fieldcropnews.com. Optimal nitrogen (N) rates for corn are a function of both soil N supply and yield. Consider both when determining N rate requirements in 2021. PSNT survey results are a general indication of soil N status across Ontario, not a substitute for sampling your own farm.
Alfalfa Weevil and Potato Leafhopper
Alfalfa weevil and potato leafhopper (PLH) are being reported at extremely high levels in many fields. Hot dry conditions have made it more favourable for these pests than their natural enemies (especially entomopathogenic fungi). Scout fields to determine if cutting is possible or if an insecticide application is necessary if thresholds are reached. Consider fields at threshold if both pests are present but populations are slightly below threshold for either pest.
Monitoring recently cut fields is extremely important as well, as infestations can overwhelm the young regrowth. Dry bean growers should also keep watch of their newly emerging dry bean plants for PLH as seed treatments will only protect the plants for a few weeks after planting.
Alfalfa weevil larvae initially feed within the leaf buds and then move to the tips of the plant. Pinholes are the first signs of damage but can quickly progress to skeletonized leaves. Heavily damaged fields will look greyish white from a distance. Heavy feeding not only impacts yield but also reduces feed quality. Fields at greater risk of alfalfa weevil include those seeded last year, pure alfalfa stands, and areas of the field with south facing slopes.
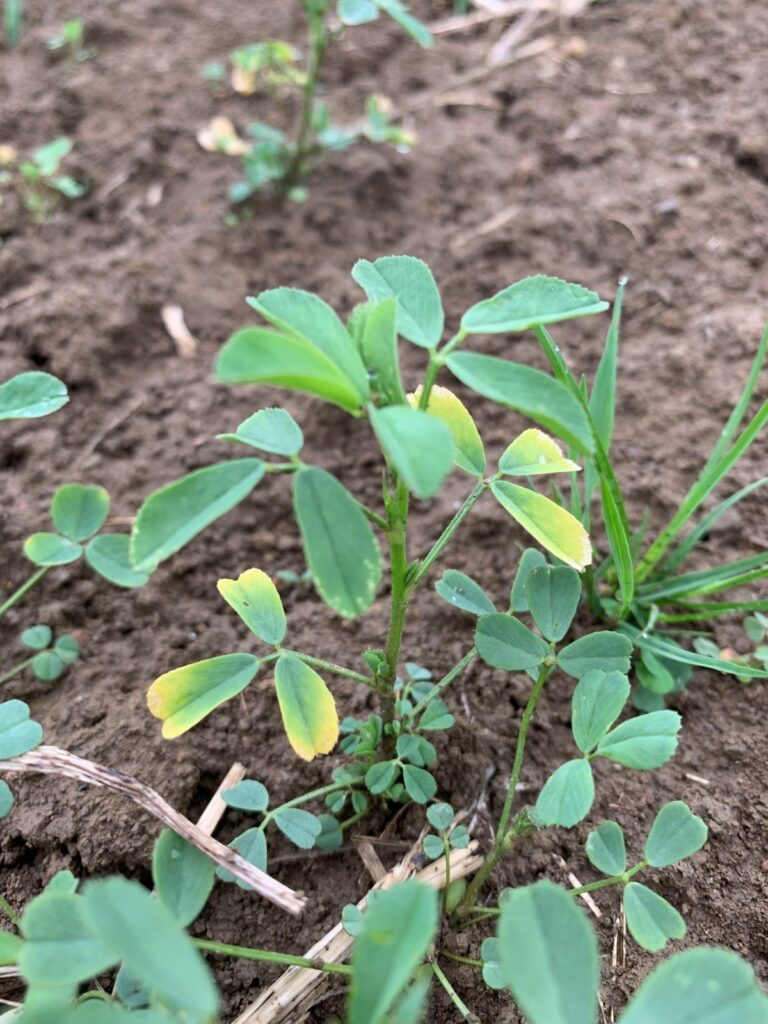
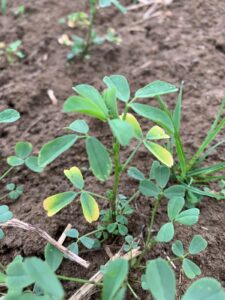
Potato leafhopper arrived recently on storm fronts from the US in heavy numbers. Most vulnerable are new seedlings and young regrowth but all stands need to be monitored frequently (twice a week at least). PLH nymphs and adults suck out plant sap while injecting a toxin into the plant that interferes with transportation of nutrients in the leaves and stem. The result is the characteristic “hopperburn”, which starts as a wedge-shaped “V” yellowish pattern at the leaf tips (Figure 1.). By the time hopperburn is noticed, yield and quality have been compromised. The taller the alfalfa, the more leafhoppers can be tolerated before control is necessary. Though PLH-resistant varieties of alfalfa are available, new seedings are still vulnerable, as the glandular hairs are not fully expressed the first year. Use the conventional thresholds below for first year seedings of these resistant varieties.
Action thresholds for both alfalfa weevil and PLH depend on the height of the plant. More information can be found at www.fieldcropnews.com. PLH is also a pest of dry beans, but insecticide seed treatments on dry beans will offer protection through the first few weeks of dry bean growth.
Weather Data
| Location | Year | Weekly May 31 – June 6 | Accumulated | ||||||
| Highest Temp (°C) | Lowest Temp (°C) | Rain (mm) | Rain (mm) April 1st | GDD 0C April 1st | GDD 5C April 1st | CHU May 1st | |||
| Harrow | 2021 | 30 | 7 | 22 | 124 | 846 | 530 | 604 | |
| 2020 | 30 | 11 | 3 | 159 | 726 | 422 | 595 | ||
| 2019 | 25 | 7 | 43 | 287 | 775 | 448 | 557 | ||
| Ridgetown | 2021 | 29 | 5 | 18 | 115 | 786 | 478 | 574 | |
| 2020 | 31 | 6 | 14 | 139 | 669 | 380 | 564 | ||
| 2019 | 25 | 5 | 12 | 226 | 696 | 381 | 482 | ||
| London | 2021 | 30 | 6 | 14 | 120 | 782 | 480 | 553 | |
| 2020 | 28 | 6 | 3 | 146 | 639 | 352 | 517 | ||
| 2019 | 24 | 5 | 18 | 243 | 645 | 345 | 468 | ||
| Brantford | 2021 | 32 | 4 | 15 | 115 | 760 | 455 | 537 | |
| 2020 | 29 | 5 | 6 | 123 | 626 | 345 | 497 | ||
| 2019 | 24 | 4 | 23 | 245 | 637 | 340 | 459 | ||
| Welland | 2021 | 29 | 4 | 11 | 82 | 758 | 450 | 523 | |
| 2020 | 27 | 8 | 6 | 137 | 652 | 364 | 519 | ||
| 2019 | 24 | 6 | 16 | 208 | 675 | 367 | 479 | ||
| Elora | 2021 | 31 | 3 | 10 | 94 | 689 | 394 | 478 | |
| 2020 | 29 | 4 | 4 | 99 | 570 | 308 | 454 | ||
| 2019 | 23 | 2 | 22 | 244 | 555 | 272 | 393 | ||
| Mount Forest | 2021 | 30 | 4 | 7 | 99 | 698 | 406 | 495 | |
| 2020 | 28 | 5 | 2 | 109 | 562 | 313 | 465 | ||
| 2019 | 23 | 4 | 129 | 537 | 263 | 380 | |||
| Peterborough | 2021 | 31 | 0 | 9 | 90 | 687 | 380 | 480 | |
| 2020 | 28 | 4 | 5 | 102 | 584 | 309 | 483 | ||
| 2019 | 24 | 2 | 16 | 239 | 573 | 280 | 401 | ||
| Kingston | 2021 | 28 | 4 | 12 | 94 | 705 | 399 | 466 | |
| 2020 | 26 | 3 | 15 | 148 | 635 | 342 | 504 | ||
| 2019 | 20 | 6 | 30 | 251 | 624 | 320 | 422 | ||
| Kemptville | 2021 | 31 | 3 | 19 | 98 | 788 | 476 | 547 | |
| 2020 | 29 | 2 | 13 | 124 | 600 | 317 | 484 | ||
| 2019 | 23 | 2 | 12 | 189 | 583 | 291 | 396 | ||
| Earlton | 2021 | 32 | 7 | 14 | 80 | 655 | 369 | 454 | |
| 2020 | 25 | 4 | 8 | 107 | 432 | 232 | 388 | ||
| 2019 | 21 | 2 | 6 | 184 | 355 | 137 | 254 | ||
| Sudbury | 2021 | 31 | 7 | 1 | 96 | 663 | 377 | 458 | |
| 2020 | 25 | 4 | 11 | 113 | 480 | 256 | 414 | ||
| 2019 | 20 | 3 | 1 | 183 | 366 | 143 | 240 | ||
| Thunder Bay | 2021 | 32 | 3 | 8 | 179 | 533 | 261 | 390 | |
| 2020 | 30 | 4 | 4 | 49 | 435 | 227 | 395 | ||
| 2019 | 26 | -2 | 32 | 139 | 362 | 131 | 257 | ||
| Fort Frances | 2021 | 36 | 2 | 1 | 114 | 587 | 308 | 482 | |
| 2020 | 29 | 7 | 4 | 59 | 500 | 269 | 443 | ||
| 2019 | 25 | -2 | 13 | 109 | 418 | 173 | 304 | ||
| Report compiled by OMAFRA using Environment Canada data. Data quality is verified but accuracy is not guaranteed. Report supplied for general information purposes only. An expanded report is available at www.fieldcropnews.com. | |||||||||