There are mixed reports on the health of dry beans in Ontario this season. While many fields look good, rains following the initially dry conditions at planting have increased the incidence of root rots as well as the risk of white mould.
Root Rot
In Ontario, the four main fungal pathogens causing root rot are Fusarium, Pythium, Rhizoctonia and Chalara (black root rot). These organisms can occur individually or in combination, which is often the case, and referred to as “root rot complex.” The amount of damage is related to the general health of the crop, field history, cultivar susceptibility and environmental conditions. Compacted soils and poorly drained fields (or areas of fields) tend to have more root rot. Where other plant health issues are present, such as herbicide injury, root rot can set in. These fungi survive in the soil in plant debris or as mycelium. They are attracted to the sugars and exudates released by the developing roots.
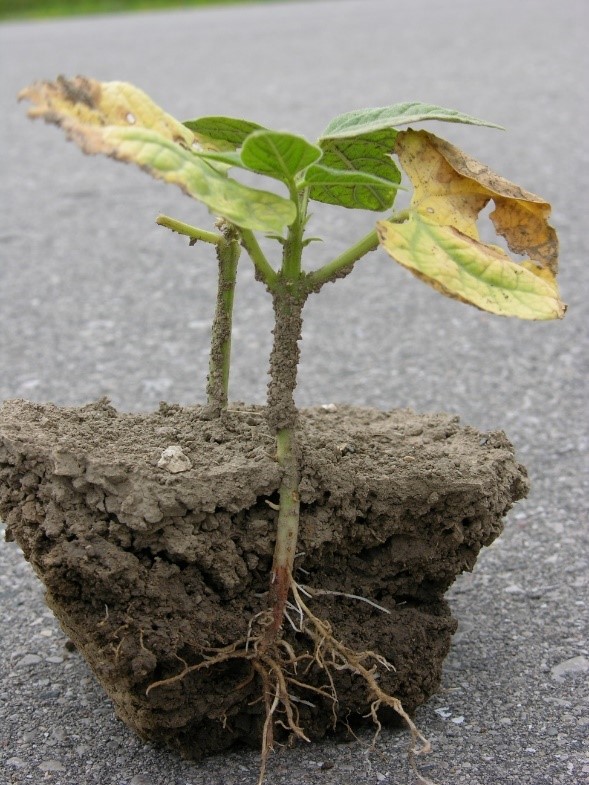 Figure 1. Root rot on a dry bean plant
Eliminating these diseases is not possible and once plants are infected there are no good control measures. Fungicide seed treatments are commonplace in Ontario dry beans and are the best defence against root rots. Dry bean variety trials are not rated for tolerance to root rot, and are generally highly susceptible, so producers are not able to select varieties based on root rot tolerance. Yield losses from these diseases can be mitigated by maintaining crop rotations that have 3 to 4 years without host crops such as soybeans, canola, peas and potatoes. Maintaining good soil health, high soil organic matter and avoiding compaction are beneficial for dry beans, which have weak root systems.
Good soil fertility promotes root growth. Where root rot is observed, applying 40-60 kg/ha (35-50 lbs/ac) of nitrogen in-crop may assist in stimulating new root growth. In wide rows, nitrogen can be injected as either anhydrous ammonia or 28%. If nitrogen is to be broadcast, forms other than urea are preferred to mitigate volatilization losses. Inter-row cultivation that hills soil around plant stems may encourage plants to form new root above the rotted taproot, provided adequate moisture exists.
White mould
White mould management begins during flowering. White mold spores can land on stems, leaves or pods but deteriorating flower petals are very susceptible to infection. Spores colonize flower tissue, and the disease enters other healthy plant tissues when infected flower petals land on leaves or stems. Infection can then rapidly spread across neighbouring plants in the field. Risk factors for white mold include field history of white mold, short crop rotations with susceptible crops, a dense canopy and warm (20-25°C), moist weather conditions.
Fungicide applications that coat flowers can help prevent the disease from infecting healthy plant tissue. Timing fungicide applications when there are 1 to 3 pin beans present on plants promotes good coverage of flower petals. If white mold risk is very high because of wet conditions, a two-pass program with applications at early bloom and again 7-10 days later may be warranted. In dry bean trials conducted by Chris Gillard, University of Guelph – Ridgetown Campus, the top performing white mold fungicides in terms of disease severity, yield and return on investment have been Senator, Allegro, Propulse and Lance. Review Gillard’s data at DryBeanAgronomy.ca .
Insects
Western Bean Cutworm (WBC) have started to appear in Ontario corn and dry bean fields. There must be pods on dry bean plants for insecticide treatment to be effective, so adding insecticide to the fungicide when targeting white mould is not effective. The best way to determine when to apply an insecticide for WBC is to have an insect trap at the field and monitor it weekly. If traps counts are high (more than 150 are caught) and pod feeding is observed, spraying is warranted 10 to 20 days after peak flight – when the number of trapped moths start to decline. This is most effective because it captures the timing when the majority of eggs have hatched, and larva are feeding. In addition, spraying insecticide when pods are on the plant is the only way to intercept the larva with insecticide because they hide in soil during the day and feed on pods at night.
Producers are advised to only apply insecticide if there are insects at threshold. More information on insects that feed on dry beans can be found at DryBeanAgronomy.ca. If two-spotted spider mites are found in dry bean or soybean, please contact Tracey.Baute@ontario.ca prior to insecticide application so that samples can be collected. Dimethoate resistance is suspected in Ontario spider mites, and OMAFRA, AAFC and Western University are collaborating on a research project to investigate resistance.
Weather Data
| Location | Year | Weekly July 5 – July 11 | Accumulated | ||||||
| Highest Temp (°C) | Lowest Temp (°C) | Rain (mm) | Rain (mm) April 1st | GDD 0C April 1st | GDD 5C April 1st | CHU May 1st | |||
| Harrow | 2021 | 32 | 21 | 0 | 242 | 1469 | 1008 | 1375 | |
| 2020 | 33 | 16 | 57 | 267 | 1493 | 1014 | 1520 | ||
| 2019 | 32 | 14 | 9 | 325 | 1422 | 940 | 1343 | ||
| Ridgetown | 2021 | 31 | 18 | 0 | 240 | 1380 | 927 | 1297 | |
| 2020 | 35 | 13 | 62 | 233 | 1419 | 954 | 1434 | ||
| 2019 | 32 | 11 | 31 | 310 | 1346 | 866 | 1265 | ||
| London | 2021 | 31 | 17 | 0 | 214 | 1371 | 924 | 1271 | |
| 2020 | 34 | 13 | 18 | 212 | 1362 | 900 | 1349 | ||
| 2019 | 33 | 12 | 23 | 325 | 1260 | 806 | 1201 | ||
| Brantford | 2021 | 30 | 16 | 0 | 205 | 1360 | 910 | 1257 | |
| 2020 | 36 | 13 | 11 | 170 | 1365 | 909 | 1332 | ||
| 2019 | 34 | 10 | 274 | 1303 | 837 | 1250 | |||
| Welland | 2021 | 29 | 15 | 3 | 133 | 1346 | 893 | 1242 | |
| 2020 | 34 | 15 | 51 | 235 | 1401 | 938 | 1405 | ||
| 2019 | 32 | 11 | 4 | 304 | 1367 | 884 | 1313 | ||
| Elora | 2021 | 30 | 15 | 0 | 167 | 1241 | 801 | 1147 | |
| 2020 | 34 | 11 | 47 | 203 | 1256 | 819 | 1249 | ||
| 2019 | 32 | 10 | 14 | 338 | 1197 | 739 | 1159 | ||
| Mount Forest | 2021 | 30 | 17 | 0 | 175 | 1251 | 813 | 1166 | |
| 2020 | 32 | 13 | 66 | 270 | 1242 | 818 | 1260 | ||
| 2019 | 31 | 9 | 129 | 1174 | 725 | 1141 | |||
| Peterborough | 2021 | 28 | 13 | 17 | 178 | 1234 | 783 | 1133 | |
| 2020 | 34 | 12 | 8 | 143 | 1269 | 824 | 1262 | ||
| 2019 | 32 | 7 | 0 | 292 | 1195 | 732 | 1115 | ||
| Kingston | 2021 | 26 | 11 | 0 | 131 | 1258 | 807 | 1142 | |
| 2020 | 32 | 14 | 41 | 198 | 1364 | 895 | 1372 | ||
| 2019 | 28 | 10 | 4 | 290 | 1311 | 832 | 1250 | ||
| Kemptville | 2021 | 28 | 11 | 0 | 172 | 1352 | 895 | 1219 | |
| 2020 | 36 | 13 | 10 | 140 | 1329 | 871 | 1312 | ||
| 2019 | 32 | 8 | 203 | 1224 | 768 | 1148 | |||
| Earlton | 2021 | 29 | 18 | 0 | 218 | 1161 | 729 | 1044 | |
| 2020 | 33 | 13 | 21 | 239 | 1094 | 719 | 1146 | ||
| 2019 | 30 | 7 | 5 | 299 | 948 | 560 | 934 | ||
| Sudbury | 2021 | 25 | 17 | 1 | 194 | 1172 | 740 | 1066 | |
| 2020 | 31 | 16 | 86 | 284 | 1157 | 758 | 1199 | ||
| 2019 | 30 | 10 | 17 | 288 | 956 | 568 | 928 | ||
| Thunder Bay | 2021 | 32 | 19 | 0 | 223 | 1042 | 624 | 963 | |
| 2020 | 30 | 12 | 7 | 99 | 1039 | 661 | 1080 | ||
| 2019 | 29 | 8 | 3 | 207 | 845 | 464 | 798 | ||
| Fort Frances | 2021 | 30 | 18 | 0 | 158 | 1108 | 684 | 1075 | |
| 2020 | 32 | 9 | 11 | 171 | 1153 | 747 | 1195 | ||
| 2019 | 30 | 5 | 26 | 185 | 978 | 568 | 938 | ||
| Report complied by OMAFRA using Environment Canada data. Data quality is verified but accuracy is not guaranteed. Report supplied for general information purposes only. An expanded report is available at www.fieldcropnews.com. | |||||||||