Tar spot in corn was first identified last year in Ontario on September 21, 2020 and confirmed to overwinter in Ontario on July 2, 2021 in West Elgin. Since then, tar spot has been also detected in Essex, Chatham-Kent, Lambton, Middlesex and Norfolk counties as of July 18, 2021 (Figure 1). This was anticipated since tar spot has continued to spread in the Midwest US since 2015 and can overwinter in the region. The frequent rains (from the midwest US especially Michigan/Indiana) and high humidity along with warm temperatures in southwestern Ontario have favoured tar spot development in 2021 (Figure 2). In most cases, incidence and severity is very low and will have minimal impact on yield as corn approaches black layer but in fields which had early infection and no fungicide there will likely be an impact on yield if favourable environmental conditions continue (Figures 2b and 2c). In the US, yield losses from 20-60 bu/acre have been observed under similar conditions.

Figure 1. Tar Spot distribution August 18, 2021


Currently there is limited long-term research-based information for disease management of tar spot in the US Midwest and Ontario but OMAFRA in conjunction with the Tar Spot Working Group (TSWG) have a number of on-going trials to develop long-term integrated pest management (IPM) strategies for tar spot management. There are no known tar spot resistant hybrids but in an OMAFRA/ screening trial in Rodney, Ontario, there appears to be varying degree of tolerance in the 64 hybrids being evaluated. Fungicide evaluations and timing trials are also being conducted in Ontario and the US which have shown many of the commercially available fungicides are effective against tar spot as well as other corn diseases such as northern corn leaf blight and Gibberella ear rot at the traditional tassel or silking (VT/R1) timing.
What can you do now?
1) Tar spot is obviously a concern and be prepared but we don’t have to fear the disease, therefore, keep updated on tar spot movement and information. TSWG has developed a real-time tar spot tracking system which includes Ontario, so please visit the Corn ipmPIPE website at http://corn.ipmpipe.org/tarspot for updates and target scouting (Figure 1).
2) Scout for tar spot and other diseases in your fields regularly. Tar spot appears as small, raised, black spots scattered across the upper and lower leaf surfaces (Figure 2). These spots are stroma (fungal fruiting structures). If viewed under the microscope, hundreds of sausage-shaped asci (spore cases) filled with spores are visible. When severe, stroma can even appear on husks and leaf sheaths. Tan to brown lesions with dark borders surrounding stroma can also develop which are known as “fisheye” lesions.
3) Keep in mind, other diseases such as rust and physoderma brown spot as well as insect frass (poop) can be confused with tar spot. Rust forms orange/red lesions which erupt through the leaf surface (volcano-like) and as they get older can turn black/dark brown but when you rub the lesions the spores do rub off leaving a smudge on your finger. Physoderma form flat brown lesions primarily on the leaf mid-rib or near leaf base unlike tar spot which usually occurs from the middle toward the tip of the leaf.
4) If you suspect tar spot, please contact OMAFRA field crop plant pathologist Albert Tenuta at albert.tenuta@ontario.ca.
For more resources and information please visit:
Ontario Diagnostic Days Episodes – #2 (2020) #8 (2020) and #3 (2021) at
www.Fieldcropnews.com or https://www.realagriculture.com/ontariodiagnosticdays
Crop Protection Network at www.cropprotectionnetwork.org/
Corn IPM Pipe – tar spot tracking and reporting at https://corn.ipmpipe.org/tarspot/
Sudden Death Syndrome
Sudden death syndrome developed early this year in the southwest and symptoms have increased the past few weeks due to the crop stage (post flowering) and weather conditions. The SDS fungus produces toxins in soybean roots that are transported to leaves and foliar symptoms are more severe after frequent or heavy midseason rains such as what we have had. SDS infected plants will begin to show distinct yellow speckling or spotting between the veins (interveinal chlorosis). As the disease progresses, these yellow areas become larger and in severe cases the entire area between the veins becomes brown (necrotic) and dry (Figure 3). The leaves curl from the outer margin. These brown areas eventually disintegrate (fall out) leaving only the veins on the leaf. All through this process the veins remain green. The next symptom is often premature defoliation and death of the plant. In most cases, the petioles (leaf stalks) on these dead plants remain attached to the stem.
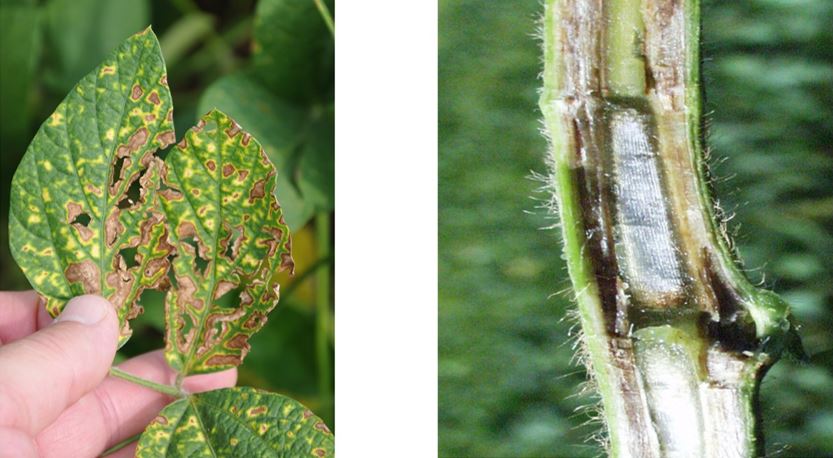
Cutting the root and the stem will expose a light brown or gray discolourization of the cortex tissue in the tap root and the stem (Figure 3). This discolourization will extend from the roots up through the stem. Although the leaf symptoms may resemble brown stem rot, in sudden death infected plants the pith (center) of the stem remains white whereas brown stem rot infected plants have a brown and disintegrated pith.
There isn’t anything that can be done at this stage for SDS, but growers should compare the various varieties they have on the farm or neighbouring fields to help in selection of SDS tolerant varieties for 2022. Consider using a SDS seed treatment such as ILEVO or Saltro which when combined with SDS resistant varieties have shown in combined regional field tests in Ontario and the Midwest US to reduce risk and disease symptoms but most importantly increase profits with a 9.5 bu/ac yield increase compared to these same seed treatments on a SDS susceptible variety (Figure 4).

Weather Data
| Location | Year | Weekly August 9 – August 15 | Accumulated | ||||||
| Highest Temp (°C) | Lowest Temp (°C) | Rain (mm) | Rain (mm) April 1st | GDD 0C April 1st | GDD 5C April 1st | CHU May 1st | |||
| Harrow | 2021 | 31 | 12 | 53 | 428 | 2373 | 1706 | 2490 | |
| 2020 | 31 | 13 | 0 | 296 | 2289 | 1635 | 2497 | ||
| 2019 | 28 | 13 | 2 | 370 | 2219 | 1562 | 2316 | ||
| Ridgetown | 2021 | 30 | 9 | 34 | 397 | 2235 | 1577 | 2341 | |
| 2020 | 30 | 12 | 0 | 298 | 2182 | 1543 | 2361 | ||
| 2019 | 28 | 11 | 9 | 514 | 2100 | 1446 | 2183 | ||
| London | 2021 | 30 | 9 | 24 | 329 | 2217 | 1565 | 2312 | |
| 2020 | 30 | 12 | 19 | 330 | 2127 | 1490 | 2275 | ||
| 2019 | 31 | 11 | 25 | 452 | 2004 | 1374 | 2106 | ||
| Brantford | 2021 | 31 | 9 | 7 | 289 | 2188 | 1533 | 2265 | |
| 2020 | 32 | 12 | 3 | 210 | 2147 | 1516 | 2261 | ||
| 2019 | 30 | 10 | 274 | 2075 | 1433 | 2166 | |||
| Welland | 2021 | 31 | 16 | 11 | 303 | 2202 | 1544 | 2306 | |
| 2020 | 31 | 13 | 0 | 269 | 2179 | 1541 | 2363 | ||
| 2019 | 28 | 10 | 5 | 362 | 2137 | 1479 | 2260 | ||
| Elora | 2021 | 30 | 10 | 5 | 265 | 2027 | 1381 | 2103 | |
| 2020 | 30 | 10 | 0 | 280 | 1971 | 1359 | 2116 | ||
| 2019 | 29 | 8 | 2 | 359 | 1641 | 1068 | 1690 | ||
| Mount Forest | 2021 | 30 | 8 | 8 | 328 | 2032 | 1390 | 2122 | |
| 2020 | 30 | 11 | 0 | 387 | 1948 | 1349 | 2129 | ||
| 2019 | 28 | 9 | 129 | 1869 | 1245 | 1978 | |||
| Peterborough | 2021 | 31 | 7 | 7 | 300 | 2028 | 1372 | 2081 | |
| 2020 | 31 | 9 | 8 | 201 | 1958 | 1348 | 2074 | ||
| 2019 | 29 | 6 | 2 | 334 | 1851 | 1223 | 1879 | ||
| Kingston | 2021 | 28 | 11 | 27 | 238 | 2089 | 1433 | 2182 | |
| 2020 | 29 | 15 | 2 | 268 | 2131 | 1487 | 2320 | ||
| 2019 | 27 | 12 | 4 | 354 | 2057 | 1403 | 2163 | ||
| Kemptville | 2021 | 31 | 9 | 24 | 264 | 2185 | 1523 | 2227 | |
| 2020 | 31 | 12 | 14 | 235 | 2109 | 1477 | 2245 | ||
| 2019 | 29 | 8 | 203 | 1958 | 1326 | 2013 | |||
| Earlton | 2021 | 29 | 8 | 30 | 452 | 1888 | 1251 | 1905 | |
| 2020 | 32 | 10 | 3 | 312 | 1773 | 1223 | 1956 | ||
| 2019 | 27 | 6 | 1 | 349 | 1543 | 995 | 1631 | ||
| Sudbury | 2021 | 29 | 9 | 49 | 366 | 1940 | 1303 | 1996 | |
| 2020 | 29 | 14 | 19 | 380 | 1842 | 1268 | 2034 | ||
| 2019 | 27 | 9 | 1 | 351 | 1573 | 1025 | 1669 | ||
| Thunder Bay | 2021 | 34 | 5 | 8 | 247 | 1784 | 1162 | 1817 | |
| 2020 | 29 | 9 | 11 | 181 | 1645 | 1102 | 1792 | ||
| 2019 | 27 | 6 | 1 | 265 | 1486 | 935 | 1553 | ||
| Fort Frances | 2021 | 33 | 1 | 16 | 202 | 1881 | 1252 | 1956 | |
| 2020 | 28 | 7 | 82 | 289 | 1785 | 1203 | 1929 | ||
| 2019 | 27 | 6 | 0 | 292 | 1612 | 1032 | 1681 | ||
| Report compiled by OMAFRA using Environment Canada data. Data quality is verified but accuracy is not guaranteed. Report supplied for general information purposes only. An expanded report is available at www.fieldcropnews.com. | |||||||||