Assessing Soybean Performance
Soybean harvest has begun, and yields have generally been good. Many growers are reporting above average yields. But there are fields that underperformed. For those fields that yielded less than expected, it’s important to assess why in order to make good management decisions for the future. Sometimes we blame the weather or a specific variety too quickly and miss an opportunity to improve outcomes for next year. Did a field mature unevenly, or did parts of a field yield much less than the rest? These can be tell-tale symptoms of underlying problems, not just soil type or drainage issues. For example, soybean cyst nematode (SCN) has become a large yield robber right across the province, including eastern Ontario. An underperforming field may be infected with low levels of SCN and the grower is unaware they have the problem.
Uneven Maturity at Harvest Time
If a soybean field is maturing unevenly, it can be a sign of an underlying issue. Sometimes the cause is obvious, such as late emerging plants. Dry soil in the spring will cause uneven fields by delaying emergence and plant senescence in the fall. This is a difficult problem to overcome, but more consistent tillage depth or the use of a planter can achieve better plant emergence. Some growers feel they can start harvest a few days earlier when using a planter compared to a drill because fields mature more evenly.
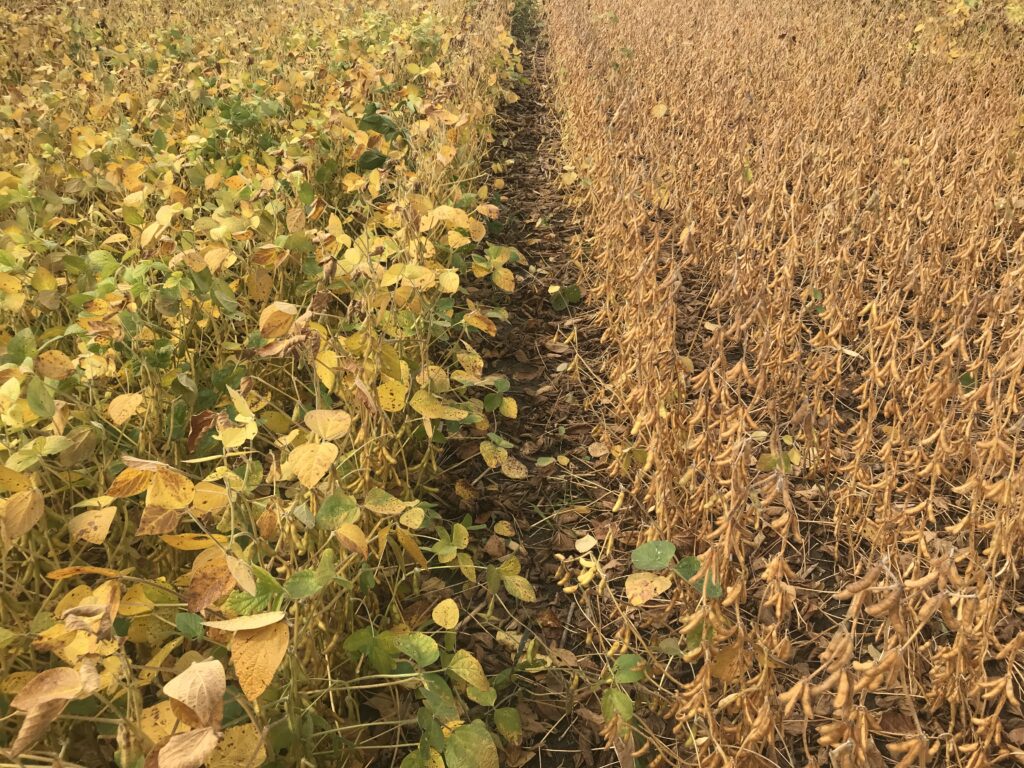
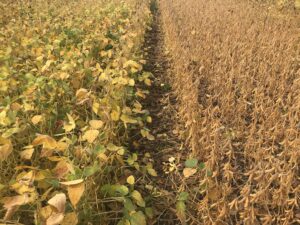
If uneven emergence was not the cause but some plants remain green, they usually have fewer pods on them. This lack of seed means that dry down is delayed. The photosynthate in the stems and leaves is not being used by the seed as the plant matures. A number of factors including herbicide drift, drought, or poor soil fertility can result in low pod set. Fertilizer trials have shown that when P and K is low plants set fewer pods and mature more slowly. Good soil fertility will facilitate even senescence (Figure 1.).
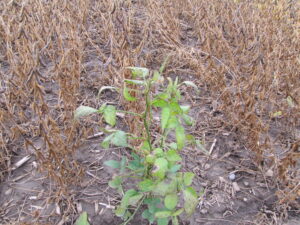
If only individual plants scattered across the field remain green, this can be the result of a genetic mutation in that plant (or in a previous generation that expressed itself this year) (Figure 2.). This mutation does not allow for normal pollen development and seed formation. Viruses transmitted by insects can also cause “stay green” plants, but viruses are often blamed when other factors are the real culprit. Although it’s impossible to control all factors which may impact the problem, ensuring good soil fertility, controlling insects, and avoiding varieties that have caused problems in the past will go a long way to reduce stay green.
Soybean Cyst Nematode (SCN)
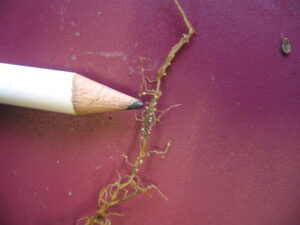
Many growers consider SCN to be a problem isolated to the extreme southwestern counties of Ontario (Essex, Kent, Lambton). This is no longer the case. As soybean acreage has increased across Ontario, so has SCN. This pest can now be found right across the major soybean growing counties province-wide. Some growers in the Ottawa valley suffered large yield losses from SCN this year even though they had not identified this pest in the past. Yield losses of up to 40% are possible without any obvious above-ground symptoms. A close inspection of the roots often revels cysts, but they may not be obvious depending on the time of year the plants are checked (Figure 3.).
Sending soil samples to a lab is the best way to determine if SCN is present. Crop rotation, resistant variety selection, and seed treatments are the main management strategies to keep SCN yield losses in check. Every soybean grower in Ontario should check for SCN if they are not sure what levels of this pest they may have in their fields.
White Mould
Some growers say that a small amount of white mould is a sign of a good crop. This is because white mould is more prevalent in lush growing conditions and in fields with good yield potential. The problem is that this small amount of white mould sets the field up for a potential major infection the next time soybeans are grown. The inoculum is now present in the field and will survive for many years. Take careful note of where white mould was present this year to make future management decisions.
There are large differences in variety tolerance to white mould, so careful variety selection is important. Seeding rates should be kept low in fields with a history of the disease and the use of wider rows will help to lower moisture levels within the canopy. No-till soybeans are far less impacted by white mould than fields that are tilled. In fields where there was heavy white mould, not conducting any tillage this fall is ideal because more of the sclerotia (overwintering bodies) will die on the soil surface.
Soybeans are a resilient crop species and can do very well if soil nutrients and moisture are adequate. But they are susceptible to certain pests and diseases. Knowing which problems caused yield losses this year will help aid in cropping decisions, making future soybean crops even better.
Weather Data
| Location | Year | Weekly September 13 – 19 | Accumulated | |||||||
| Highest Temp (°C) | Lowest Temp (°C) | Rain (mm) | Rain (mm) April 1st | GDD 0C April 1st | GDD 5C April 1st | CHU May 1st | ||||
| Harrow | 2021 | 31 | 13 | 7 | 462 | 3108 | 2271 | 3392 | ||
| 2020 | 25 | 2 | 9 | 389 | 2967 | 2138 | 3320 | |||
| 2019 | 30 | 13 | 3 | 489 | 2919 | 2088 | 3191 | |||
| Ridgetown | 2021 | 29 | 10 | 14 | 454 | 2938 | 2110 | 3197 | ||
| 2020 | 24 | -1 | 4 | 430 | 2814 | 2000 | 3118 | |||
| 2019 | 28 | 11 | 2 | 560 | 2758 | 1928 | 2988 | |||
| London | 2021 | 27 | 8 | 11 | 407 | 2908 | 2084 | 3147 | ||
| 2020 | 23 | -1 | 6 | 460 | 2735 | 1924 | 2998 | |||
| 2019 | 27 | 9 | 1 | 551 | 2614 | 1814 | 2844 | |||
| Brantford | 2021 | 29 | 9 | 32 | 408 | 2878 | 2054 | 3080 | ||
| 2020 | 25 | -1 | 5 | 246 | 2764 | 1958 | 2982 | |||
| 2019 | 24 | 10 | 274 | 2703 | 1886 | 2917 | ||||
| Welland | 2021 | 28 | 11 | 48 | 449 | 2894 | 2065 | 3147 | ||
| 2020 | 24 | 3 | 22 | 326 | 2821 | 2008 | 3136 | |||
| 2019 | 24 | 9 | 15 | 458 | 2743 | 1920 | 3002 | |||
| Elora | 2021 | 27 | 7 | 20 | 363 | 2663 | 1848 | 2860 | ||
| 2020 | 22 | 0 | 3 | 347 | 2529 | 1742 | 2759 | |||
| 2019 | 23 | 8 | 15 | 465 | 2183 | 1440 | 2324 | |||
| Mount Forest | 2021 | 27 | 8 | 28 | 484 | 2664 | 1852 | 2882 | ||
| 2020 | 23 | -1 | 22 | 479 | 2501 | 1727 | 2773 | |||
| 2019 | 23 | 8 | 129 | 2436 | 1637 | 2643 | ||||
| Peterborough | 2021 | 26 | 5 | 14 | 363 | 2664 | 1838 | 2826 | ||
| 2020 | 25 | -3 | 7 | 326 | 2569 | 1769 | 2776 | |||
| 2019 | 24 | 4 | 11 | 383 | 2393 | 1591 | 2496 | |||
| Kingston | 2021 | 24 | 10 | 5 | 273 | 2772 | 1946 | 3035 | ||
| 2020 | 22 | 0 | 13 | 347 | 2729 | 1911 | 3035 | |||
| 2019 | 22 | 7 | 6 | 418 | 2667 | 1838 | 2894 | |||
| Kemptville | 2021 | 26 | 7 | 19 | 333 | 2858 | 2026 | 3031 | ||
| 2020 | 22 | 0 | 5 | 360 | 2657 | 1849 | 2880 | |||
| 2019 | 24 | 4 | 203 | 2532 | 1725 | 2677 | ||||
| Earlton | 2021 | 25 | 5 | 12 | 533 | 2460 | 1653 | 2562 | ||
| 2020 | 22 | -2 | 22 | 419 | 2213 | 1489 | 2416 | |||
| 2019 | 25 | 3 | 10 | 434 | 2018 | 1300 | 2152 | |||
| Sudbury | 2021 | 25 | 6 | 12 | 453 | 2509 | 1704 | 2666 | ||
| 2020 | 19 | -1 | 25 | 539 | 2282 | 1538 | 2496 | |||
| 2019 | 23 | 6 | 10 | 444 | 2078 | 1361 | 2238 | |||
| Thunder Bay | 2021 | 24 | 2 | 29 | 325 | 2352 | 1559 | 2468 | ||
| 2020 | 18 | -4 | 5 | 297 | 2155 | 1421 | 2360 | |||
| 2019 | 26 | 6 | 23 | 405 | 1955 | 1239 | 2067 | |||
| Fort Frances | 2021 | 23 | -1 | 13 | 281 | 2418 | 1619 | 2568 | ||
| 2020 | 23 | -7 | 0 | 334 | 2243 | 1490 | 2452 | |||
| 2019 | 29 | 1 | 28 | 525 | 2111 | 1356 | 2217 | |||
| Report compiled by OMAFRA using Environment Canada data. Data quality is verified but accuracy is not guaranteed. Report supplied for general information purposes only. An expanded report is available at www.fieldcropnews.com. | ||||||||||