
Fertilizing for maximum return, not maximum yield, increases profits and reduces input costs. With fertilizer prices at record highs heading into the 2022 growing season, we have summarized key findings from Ontario research on fertilizer and crop price and their impact on optimal nitrogen (N), phosphorus (P) and potassium (K) rates.
The simple answer
Managing nitrogen
Ontario research has shown that if you are +/- 25 lb N/ac of the most economic rate of nitrogen, you’ll be within $10/ac of the maximum net return. You don’t need to hit the mark perfectly. When the price of N versus corn is significantly higher than normal, reducing your usual rates by as much as 30 lb of N/acre may be justified. Download Ontario’s Corn N Calculator for a more precise calculation of the most economical rate of nitrogen.
Managing phosphorus and potassium
Knowing soil test values and applying P and K based on likelihood of crop response will be more important than the price of P or K. If a soil tests >20 ppm (Olsen) for P and 120 ppm for K, consider delaying nutrient removal application by one season.
A little more information
Our rate recommendations for N used the Ontario Corn Nitrogen Calculator* to compare the effect of N fertilizer cost to corn price on the most economic fertilizer rate.
| Urea ($/MT) | Corn (price/bu) | N recommendation (lb/ac) 2900 CHU | N recommendation (lb/ac) 3250 CHU |
| $608 | $4.75 | 162 | 175 |
| $1,217 | $4.75 | 120 | 132 |
| $608 | $6.50 | 174 | 186 |
| $1,217 | $6.50 | 143 | 155 |
The calculator can be downloaded from “Google Play” or Apple’s “App Store”
Our rate recommendations for P and K are based on the Ontario phosphorus and potassium database.
- Changes in nutrient cost relative to corn price do not significantly change recommended rates. Based on 77 multi rate response trials, a 50% change in fertilizer price resulted in only a 7 lb P2O5/ac difference in optimal rate for corn.
- Applying potassium does not typically provide an economic yield response for corn and soybeans when soil test K is >100 ppm.
The full story
Here is more detail on fertilizer rate recommendations, as well as other factors to consider in N rate reductions and
managing P and K with higher fertilizer prices.
Ontario Corn Nitrogen Calculator
Recommendations with the calculator are based on a database of N response trials conducted from 1970-2002.
The calculator adjusts N recommendations by a set value per change in N cost: crop price, based on changes in the
most economic N rate. The corn nitrogen database is managed by Ken Janovicek at the University of Guelph.
Net return on nitrogen
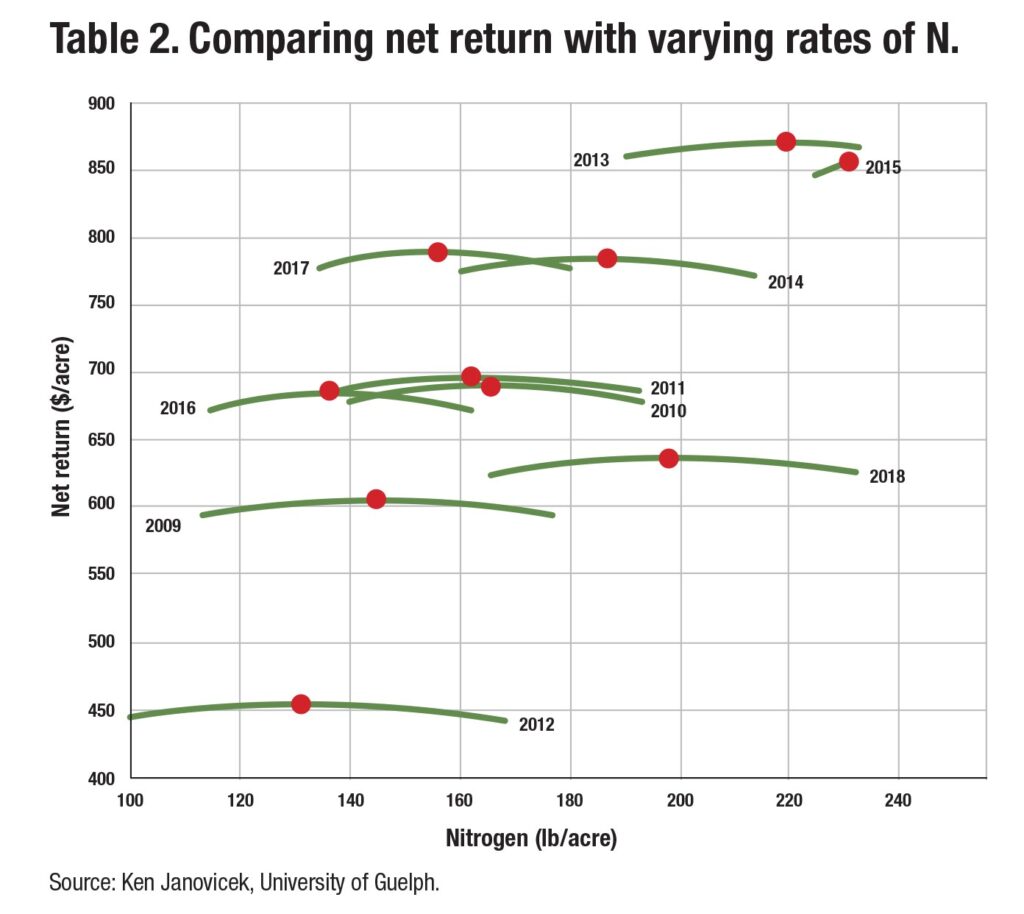
Table 2 shows the results of a 10-year corn nitrogen trial near Elora, Ontario. The red circles indicate the rate of N
that provided the optimal net return. The green curve for each year shows the range of N rates that provided a net
return within $10 per acre of the maximum. If you are within 25 lb N/ac of the optimal rate, you will achieve close
to the maximum return.
Not all soils behave the same
- Fields that have a history of manure application and forages in rotation have a higher nitrogen supplying capacity. For these fields, follow the corn nitrogen calculator recommendation for N rate reduction.
- Fields with a history of annual crops and commercial fertilizer only are more likely to be N deficient. Consider a more conservative approach to N rate reduction for these fields.
The Ontario P and K database
This resource contains data from 368 research trials that evaluated response to P and/or K in corn, soybeans, winter wheat and alfalfa. The database was compiled in 2015 by OMAFRA in partnership with the University of Guelph, and a report on the database can be found at fieldcropnews.com. Here are some highlights:
- When soil test P is >12 ppm P (Olsen), most economic yield responses by corn, soybeans, wheat and alfalfa were achieved by starter fertilizer rates only (e.g.18 lb-P2O5/ac).
- Band applications of P for corn and wheat were more effective and efficient than broadcast applications.
Skipping a year of crop removal for P and K make sense if you already have high background fertility. In a single year:
- 200 bu/ac corn crop will lower soil test P by ~2 ppm and soil test K by ~3 ppm
- 60 bu/ac soybean crop will lower soil test P by ~1.5 ppm and soil test K by ~4 ppm
- 100 bu/ac wheat crop (straw removed) will lower soil test P by ~2 ppm and soil test K by ~4.5 ppm