
Simple Summary
- If you have an N rate you are confident is right for your farm most years, N recommendations and historical work suggests a 15-20 lb-N/ac reduction may be appropriate to adjust for nitrogen/corn economics in 2022 compared to the longer term.
- The above adjustment assumes relatively normal N responses in 2022… large changes in N response (N-loss, yields) year to year can change optimum N rates more than changes in economics.
- Investigate scenarios with the Ontario Corn Nitrogen Calculator that reflect your agronomics and costs/prices.
- Building N-response data on-farm over time can give an idea of how close application rates may be to optimum and provide confidence for adjusting N rates in the future.
Writing this article in the winter of 2022 following a very strong run up in fertilizer prices, a common question has been “what should my nitrogen (N) rate be for corn this year?”.
I break this into two questions:
- How do optimum N rates change with fertilizer prices?
- What is the optimum N rate on your farm?
Question 1: How do optimum N rates change with fertilizer N prices?
Exhibit A
An easy way to see how N recommendations change with fertilizer N prices is to use the Ontario Corn Nitrogen Calculator at gocorn.net (available HERE).
Using your general agronomic information and then changing corn and fertilizer prices can demonstrate how recommendations change. Consider two examples of:
- what might be a 10-year average cost/price scenario ($0.60/lb-N and $5.00/bu corn)
- what might be a 2022 cost/price scenario ($1.20/lb-N and $6.75/bu new crop corn)
Table 1. Ontario corn nitrogen calculator recommendations for 10-year average and 2022 cost/price scenarios.
| Ontario Corn Nitrogen Calculator - Agronomic Information | ||
| Soil Type | Clay Loam | |
| Proven Yield (bu/ac) | 200 | |
| CHU for Area | 3000 | |
| Previous Crop | Cereals (straw not removed) | |
| Ontario Corn Nitrogen Calculator – Cost/Price Information | 10-Year Average | 2022 |
| Corn Price ($/bu) | $5.00 | $6.75 |
| Fertilizer Product | UAN 28-0-0 | UAN 28-0-0 |
| Fertilizer Product Price ($/tonne) | $370 | $740 |
| Nitrogen Price ($/lb) | $0.60 | $1.20 |
| Price Ratio ($lb-N:$lb-corn) | 6.7 | 10.0 |
| Ontario Corn Nitrogen Calculator - Nitrogen Recommendations | ||
| Preplant N Recommendations (lb-N/ac) | 187 | 167 |
| Sidedress N Recommendations (lb-N/ac) | 150 | 134 |
Changing from the 10-year average to 2022’s cost/price reduces preplant N recommendations from 187 lb-N/ac to 167 lb-N/ac, a 20 lb-N/ac reduction. So, the price of N doubles and N recommendations only decline 9%? Clearly these recommendations don’t adjust properly… do they?
Getting to Know MERN – The Most Economic Rate of Nitrogen
MERN is the optimum rate of nitrogen – the point on an N response curve where net returns to N are maximized (for more background on MERN, see the article “Understanding MERN (Most Economic Rate of Nitrogen) for Corn” (Rosser, 2022a)). Looking at real N response curves, how does MERN change with corn and N prices?
The best fitting relationship for N response curves is often a quadratic-plateau where yields increase at a decreasing rate (“quadratic”) until a maximum point where they stop responding (“plateau”) (Fig 1). The quadratic portion of the response curve produces diminishing returns – as each additional unit of N is applied, less yield is produced. MERN occurs where the next unit of N no longer provides enough yield response to pay for its cost, usually occurring a little before maximum yields (Fig. 1).
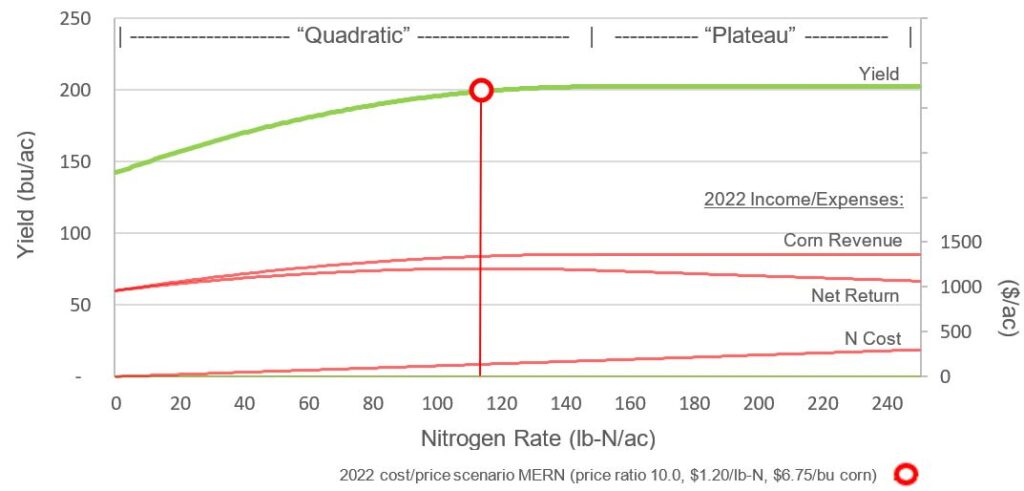
Figure 1. Quadratic-plateau yield response with 2022 cost/price scenario MERN for a corn nitrogen trial near Ilderton in 2012.
Getting to Know Price Ratios
As fertilizer costs and corn prices change, it changes the cost/price tradeoff and where MERN falls on the curve. What really dictates the position is the ratio of the two. For example, $0.60/lb-N and $6.00/bu corn has the same price ratio and MERN as $1.20/lb-N and $12/bu corn ($12 corn… one can dream).
- higher ratios (N increasingly expensive relative to corn) reduce MERN
- lower ratios (N becoming less expensive relative to corn) increase MERN.
Price ratios for various N cost and corn prices are presented in Table 2. The 2022 scenario ratio was 10.0, while the 10-year average scenario ratio was 6.7. Figure 2 demonstrates how MERN shifts as price ratios change. In this case, we see that the 2022 scenario results in a MERN 10 lb-N/ac less than the 10-year average scenario (116 lb-N/ac versus 126 lb-N/ac respectively).

Figure 1. Quadratic-plateau yield response with 2022 cost/price scenario MERN for a corn nitrogen trial near Ilderton in 2012.
Table 2. Price ratios for various nitrogen fertilizer costs and corn prices
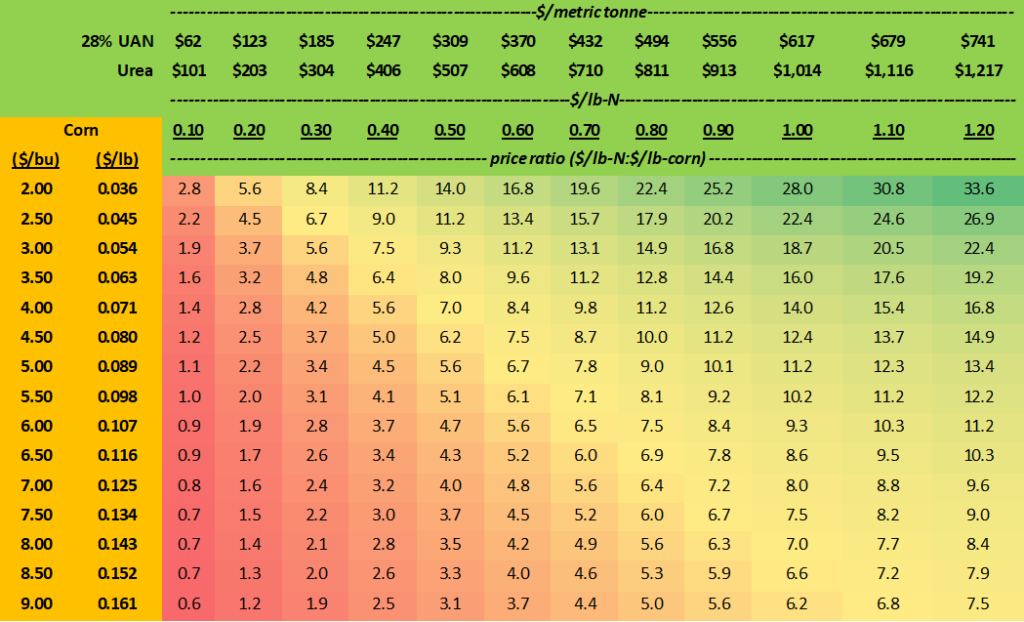
Exhibit B
What does the change in MERN look like across many trials? Figure 3 shows 15 on-farm N response curves from across Southern Ontario from a 2011-2014 corn N project by former OMAFRA corn specialist Greg Stewart. If we compare MERN for these curves using the 10-year average (closed green dots) and 2022 (open red dots) cost/price scenarios, the 2022 scenario reduces MERN on average from 161 to 149 lb-N/ac, a reduction of 12 lb-N/ac or 8%. Reductions ranged from 3 to 22 lb-N/ac.
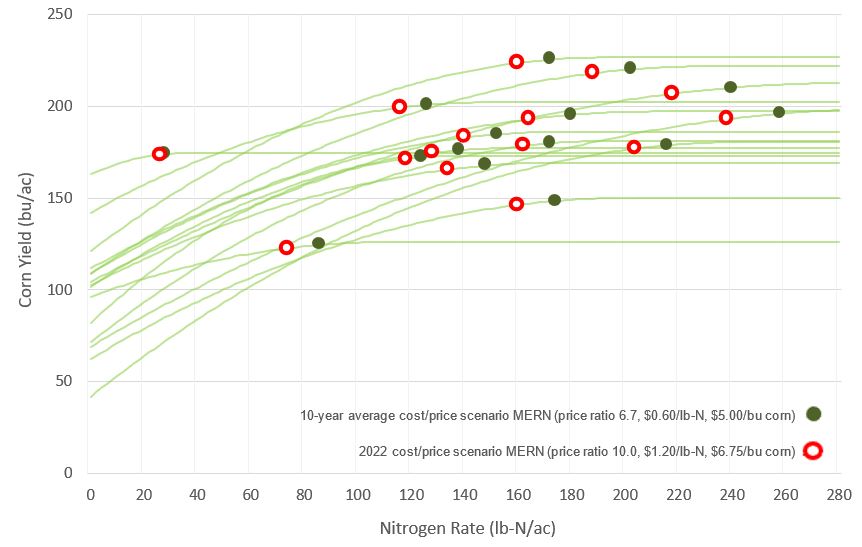
Figure 3. 15 corn N response curves with MERN for 10-year average and 2022 price scenarios from Southern Ontario, 2011-2014.
A long-term N trial at the Elora Research Station by former cropping system professor Dr. Bill Deen showed similar results (Deen et al, 2015). Interpolating from price ratios on their graph, the 2022 price ratio would maybe reduce MERN ~10-15 lb-N/ac compared to the 10-year average price ratio.
Why Don’t High N Costs Change the Optimum N Rate More?
How does a doubling in N prices only change optimum N rates by 10%? There are a couple reasons:
- In the 2022 scenario, the severity of change is partially muted by higher corn prices. While the price ratio is higher than normal, it is not as high as it would be if corn remained at $5.00/bu. MERN would change more in this scenario (though maybe still not as much as one might expect).
- If yield gains diminish as N rates increase, the opposite is true as N rates are reduced… yield losses increase faster as each unit of N is removed. It doesn’t take long to reach a steeper part of the curve where lost yield costs more than the savings of reducing N. This often occurs quickly even when N is relatively expensive.
Question 2: What is the Optimum N Rate on Your Farm?
The above information is good if you are confident your N rate is typically close to optimum most years. If you aren’t sure or are wondering if you have more room to pull back N rates, your question might be “how close is my actual N rate to optimum?”. Are you typically very close to the edge, or applying rates much higher than normally required?
Nitrogen recommendation tools (e.g. N calculator, PSNT testing) give estimated optimum N rates from historical data, but the only way to confidently know is to collect N response data on-farm. There are several ways to do this, but the simplest could be a couple N strips higher and lower (e.g. +/- 30 lb-N/ac) than your normal rate.
- If over time you notice there is no yield loss for reducing 30 lb-N/ac, even during very high N response years (e.g. exceptionally high yielding years like 2021) perhaps this gives confidence to reduce N rates
- If reducing N results in some yield loss in some years, perhaps your rate isn’t far off.
- If you don’t measure, you don’t know what room you have
It would be important to collect data over several years, as optimum N rates vary year to year due to variability in N-response. Deen et al (2015) show that year-to-year variability in N response at the Elora Research Station (usually driven by yield demand) changes MERN much more than changes in price ratios. For instance, if this year turned out to be an exceptional growing season with yields and N responses well above normal, optimum N rates could be more than 15-20 lb-N/ac higher and offset adjustments made for economics.
Last, in case you don’t traditionally include any N credit for manure of N-contributing crops like red clover or alfalfa, high N price years would be a good time to consider doing so. See Agrisuite or Agronomy Guide for Field Crops for more details.
For more information on zeroing in on the right N rate for your farm, see the article “What Rate of Nitrogen Should I Be Applying on My Corn” (Rosser, 2022b).
References
Deen, B., K. Janovicek, J. Lauzon and T. Bruulsema. 2015. Optimal rates for corn nitrogen depend more on weather than price. Better Crops. 99:16-18.
Rosser, B. 2022a. Understanding MERN (Most Economic Rate of Nitrogen) for Corn. FieldCropNews.com. https://fieldcropnews.com/2022/02/understanding-mern-most-economic-rate-of-nitrogen-for-corn/.
Rosser, B. 2022b. What Rate of Nitrogen Should I Be Applying on My Corn? FieldCropNews.com. https://fieldcropnews.com/2022/02/what-rate-of-nitrogen-should-i-be-applying-on-my-corn/.
Acknowledgements
Thanks to Ken Janovicek, University of Guelph, for assistance with N response data and MERN calculations.