Simple Summary
- MERN stands for the Most Economic Rate of Nitrogen, the rate that maximizes economic returns to N fertilizer
- MERN is influenced most strongly by variability in N response across environments (fields, parts of fields, growing seasons)
- MERN is also influenced by changes in corn and nitrogen fertilizer prices, but very significant changes in nitrogen:corn price ratios are required to change MERN appreciably
- While calculating true MERN requires several N rates and software to fit N response curves, MERN can be estimated on-farm using the two-rate zero-N and N-rich “delta-yield” approach with the N Rate Evaluator tool at GOCorn.net
What is MERN?
When talking about corn nitrogen management, conversations often revolve around MERN… what is this MERN we speak of?
MERN stands for the Most Economic Rate of Nitrogen, or the rate of nitrogen (N) fertilizer that provides the greatest economic return. This is important economically, but also environmentally as MERN represents an N rate that meets crop requirements without excess, avoiding environmental costs of producing excess fertilizer or leaving excess N in the environment.
How is MERN Calculated?
Generating N Response Data
To calculate MERN, we need to develop an N response curve. Typically, this is generated by:
- collecting yields from four or five N rates (each ideally replicated several times)
- including a “Zero-N Rate” around 0 lb-N/ac (e.g. starter-only nitrogen)
- including an “N-Rich” rate that is expected to max-out yield response to N (e.g. 200-250 lb-N/ac)
- including 2 or 3 N additional rates equally spaced between Zero-N and N-Rich rates
An example of yield responses to a past Ontario corn nitrogen trial using 5 N rates is presented in Figure 1.
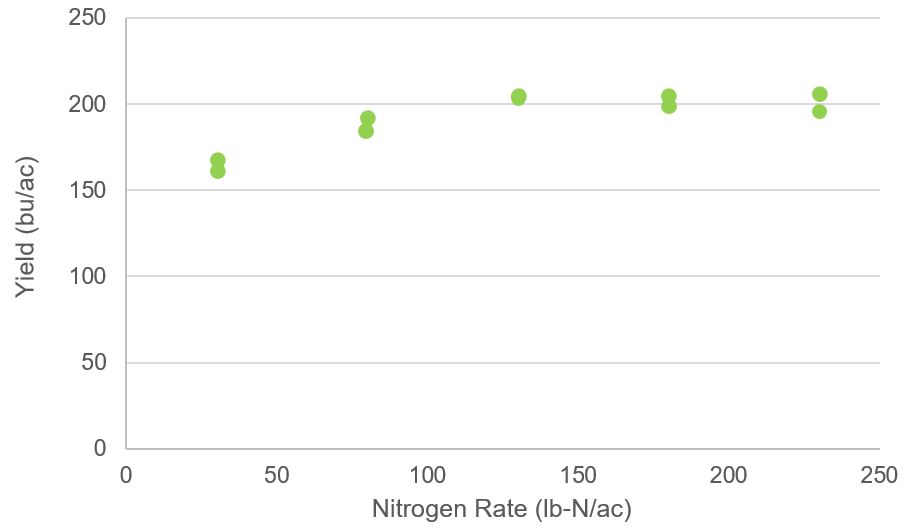
Figure 1. Example of a corn nitrogen response trial near Ilderton in 2012.
Fitting a Nitrogen Response Curve
Statistical software is used to fit an N response curve to the yield response data. The best fitting relationship for N response curves is often a quadratic-plateau where yields increase at a decreasing rate (“quadratic”) until a maximum point where they stop responding (“plateau”) (Fig 2). The quadratic portion of the N curve produces diminishing returns – as each additional unit of N is applied, less yield is produced.
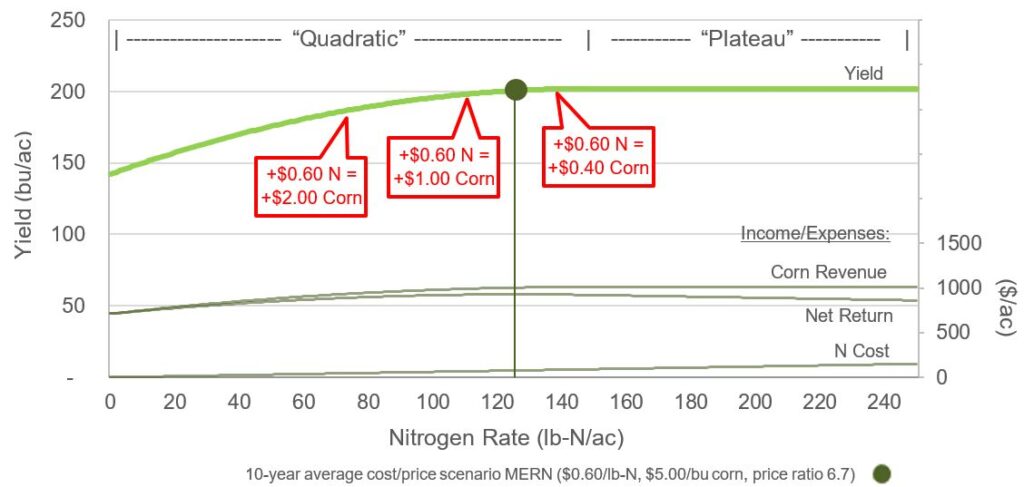
Figure 2. Quadratic-Plateau yield response and MERN for a 10-year average cost/price scenario from a corn nitrogen trial near Ilderton in 2012.
Calculating MERN
MERN is the optimum rate of nitrogen – the point on the curve where net returns are maximized. This occurs where the cost of the next unit of N is equal to the additional yield value that unit provides, usually found a little before maximum yields are attained on the N response curve.
For example, using what might be 10-year average nitrogen ($0.60/lb-N) and corn ($5.00/bu) prices in Figure 2:
- where the next pound of N costs $0.60 and produces $2.00 more corn, it makes good sense to apply that pound
- where the next pound of N costs $0.60 and produces $1.00 more corn, it still makes good sense to apply that pound (though we are receiving less corn value for that pound of N than we did for earlier pounds of N)
- where the next pound of N provides only enough corn to pay for itself is where economic response is maximized (MERN)… for the price scenario above, this occurs at 127 lb-N/ac producing 201 bu/ac of corn (solid green dot)
- where the next pound of N costs $0.60 but produces anything less than $0.60 of corn, it does not make sense to apply that N
To verify the above is true, we can also look at the income/expense curves for the above N response curve at the given N and corn prices in Fig. 2.
- Corn Revenue is simply corn yield multiplied by the price of corn (e.g. $5.00/bu in Fig. 2)
- N Cost is the nitrogen rate multiplied by the cost per unit (e.g. $0.60/lb-N in Fig. 2)
- Net Return is the difference between Corn Revenue and N Cost
- MERN occurs where Net Return is the greatest
What Influences MERN?
MERN changes as N response curves change across environments (fields, areas of fields or growing seasons) and can also shift on any given N response curve as N or corn prices change.
Corn Yield Response to Nitrogen
Different shaped curves produce different MERNs. Curve shapes are strongly influenced by:
- Zero-N yields, which are influenced by natural soil N mineralization/supply potential (and possibly ability of soil to not lose mineralized N)
- N-rich yields (yield plateau), which are influenced by yield potential of the environment when N is not limiting
The difference between zero-N and N-rich yields (also called “delta yield”) is the yield we can capture using N fertilizer. In general, the greater the yield difference, the greater the amount of N required to maximize yields, and the greater MERN will be.
A good example of this is research from the Elora Research Station by former University of Guelph Cropping System professor Dr. Bill Deen. Figure 3 shows 10 curves from a 2009-2018 corn-on-corn N trial on the same 4-acre test field every year. Because plots stayed in the exact same spot every year, curves show how growing seasons influence yield potential, yield response to N, and MERN year-to-year.
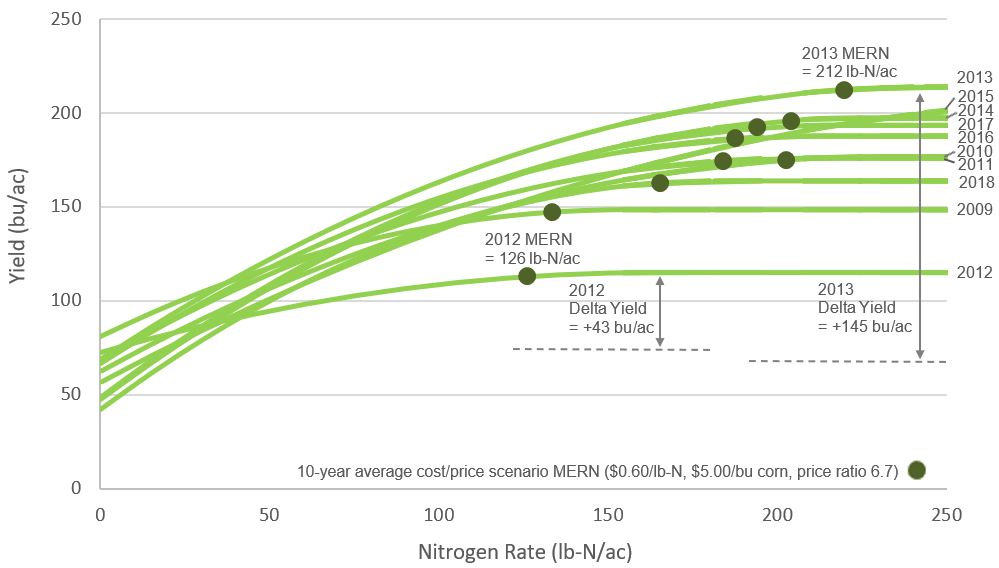
Figure 3. Yield response to N and MERN across 10 years within the exact same test area at the Elora Research Station.
In this dataset, because zero-N yields were relatively consistent year to year, there was a strong relationship between yield potential and MERN. As yield potential increased, so did MERN.
Low yielding years had low yield responses to N and low MERN values. For example, in 2012, a drought year at Elora:
- yields plateau at 115 bu/ac
- there was a +43 bu/ac yield response (“delta yield”) to N
- MERN was 126 lb-N/ac
High yielding years had large yield responses to N and large MERN values. For example, in 2013:
- yields plateau at 214 bu/ac
- there was a +145 bu/ac yield response to N
- MERN was 212 lb-N/ac
If we temporarily exclude 2015 (yields did not plateau for the N rates tested, MERN can only be estimated), MERN across the remaining 9 years averaged 180 lb-N/ac but ranged from 126 to 212. The average year-to-year deviation of MERN from the 9-year average was 24 lb-N/ac. Clearly, N response, whether over time like this Elora trial or potentially spatially within/across fields, has a significant influence on MERN.
(For a little more on how concerned we should be about this variability economically, see the article “How Perfect Do My Corn Nitrogen Rates Have to Be to Maximize Economics?” (Rosser, 2022a))
Corn and Fertilizer Prices
As fertilizer costs and corn prices change, it changes the cost/price tradeoff and where MERN falls on any N response curve. However, what really dictates the position is the ratio of the two. For example, $0.60/lb-N and $6.00/bu corn would have the same MERN as $1.20/lb-N and $12/bu corn ($12 corn… one can dream). As price ratios change, it shifts where MERN falls on the curve.
- higher ratios (N increasingly expensive relative to corn) reduce MERN
- lower ratios (N becoming less expensive relative to corn) increase MERN
Price ratios for various N cost and corn prices ($/lb-N:$lb-corn) are presented in Table 1. For example, price ratios might be:
- 6.7 for 10-year (2012-2022) average prices ($0.60/lb-N, $5.00/bu corn)
- 10.0 in mid-winter 2022 following a runup in N fertilizer prices ($1.20/lb-N, $6.75/bu new crop corn)
Table 1. Price ratios for various nitrogen fertilizer costs and corn prices
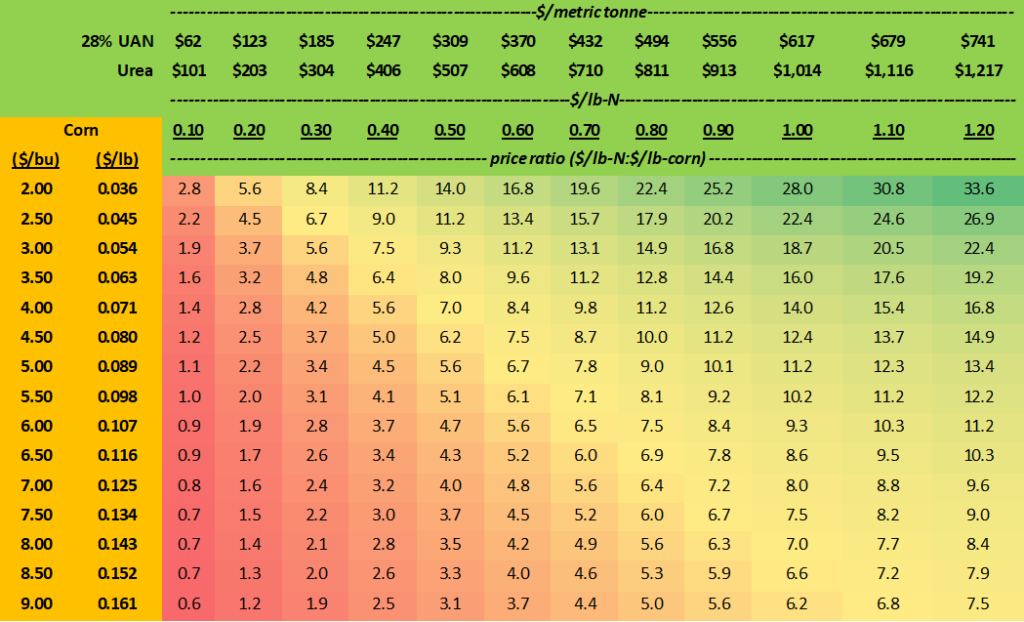
Figure 4 demonstrates how MERN shifts as price ratios (PR) change. In this case, the winter 2022 scenario (PR=10.0) results in a MERN 11 lb-N/ac less than the 10-year average scenario (PR=6.7) (116 lb-N/ac versus 127 lb-N/ac respectively).
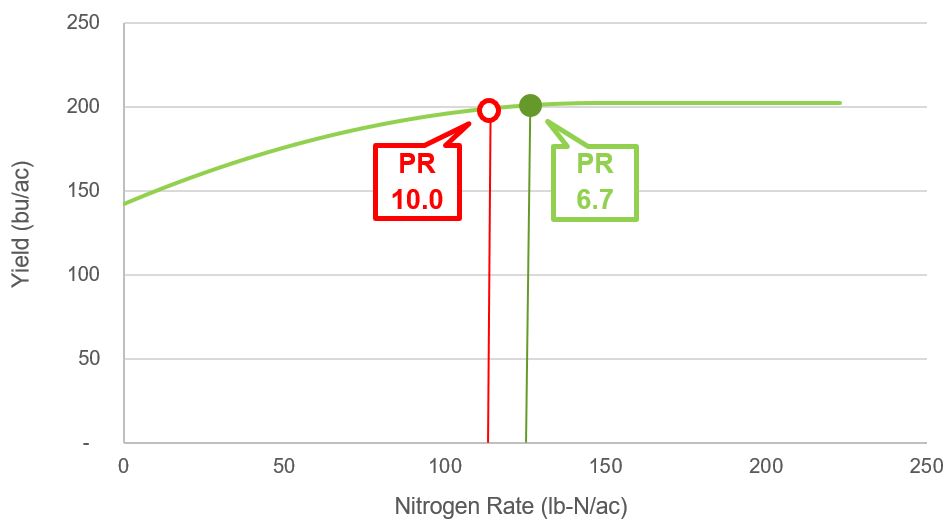
Figure 4. Quadratic-Plateau yield response and shift in MERN as the N:corn price ratio changes from 6.7 to 10.0 from a corn nitrogen trial near Ilderton in 2012.
In general, it takes very significant changes in price ratios to appreciably shift MERN. As shown by Dr. Bill Deen’s research at Elora, year-to-year variability in N response can be a much stronger driver of MERN than changes in price ratios (Deen et al, 2015).
Determining MERN On-Farm
If you would like to know how your normal program compares to MERN, for instance to know how close to the edge you are if you are thinking about adjusting N rates, there are a couple options:
- One method is to follow the above steps. This would be the most accurate but takes a fair bit of field work and statistical software.
- A shortcut would be to estimate MERN using the “delta yield” method (Janovicek et al, 2020) which only requires 2 N rates – 1) a zero N rate and 2) an N-rich rate
- as shown in Fig 3, there is a strong relationship between “delta yield” (yield difference between N-rich and zero-N) and MERN
- the “N-Rate Evaluator Tool” at gocorn.net uses delta yield to estimate MERN
- for more details, see “What’s Your Number? A Simple 2-Rate Method of Estimating Optimum Corn Nitrogen Rates On-Farm (the Delta Yield Approach)” (Rosser 2022c).
- The last, simplest approach is to apply a couple strips a little (e.g. 30 lb-N/ac) over and under your normal N rate and observe changes in yield. This won’t give deliver a MERN value but will indicate if there are yield changes for adjusting your current N rate and provide an indication of where you may be on the response curve.
Collect Data Across Years
Of course, the environment is not consistent and we all know N response (and MERN) varies year to year (as shown in Figure 3). If you are trying to narrow in on optimum N rates, building N response data on-farm over several years may indicate how close your normal N program might be to optimum, and whether you can confidently adjust N rates without taking on significant risk (Rosser, 2022b). For instance, if on-farm data over time shows that MERN is consistently lower than your normal N program, or that reduced N rates do not lose yield even in the highest N demand years, perhaps this provides confidence that that N rates can be reduced with little risk.
Optional Reading for Agronomy + Math Nerds Only
If you have a quadratic yield response equation and fond memories of high-school calculus, you can calculate MERN arithmetically from the N:corn price ratio and the quadratic equation using the following formula:
MERN = Price Ratio ($lb-N:$lb-corn) - Linear Coefficient
                   2 x Quadratic Coefficient
The above equation assumes your quadratic response is calculating yield in the same units as nitrogen rates (e.g. lb-corn/ac and lb-N/ac). If your quadratic equation is calculating bu/ac from lb-N/ac as in Fig. 2, you must divide price ratio by the number of pounds in a bushel of corn:
MERN = (Price Ratio ($lb-N:$lb-corn)/56) - Linear Coefficient
                      2 x Quadratic Coefficient
As proof, the quadratic portion of yield response in Fig. 2 is:
Y = 142.13 + 0.80675x - 0.00271x2
Where x is N rate in lb-N/ac and Y is yield in bu/ac.
Using the same N and corn prices in Fig. 2 ($0.60/lb-N, $5.00/bu) results in a price ratio of 6.7 (Table 1) which solves as:
MERN = (6.7/56) - 0.80675
         2 x (-0.00271)

MERN = 127 lb-N/ac
By setting the second derivative of the quadratic N response equation to equal the N:corn price ratio, then rearranging to solve for the nitrogen rate that makes that true (MERN), one can now rescind any possible affirmations to high school calculus teachers that calculus will never serve them in real life (at least the author can).
References
Deen, B., K. Janovicek, J. Lauzon and T. Bruulsema. 2015. Optimal rates for corn nitrogen depend more on weather than price. Better Crops. 99:16-18.
Janovicek, K., K. Banger, J. Sulik, J. Nasielski and B. Deen. 2020. Delta yield based optimal nitrogen rate estimates for corn are often economically sound. Agron. J. 113:1961-1973.
Rosser, B. 2022a. How Perfect Do My Corn Nitrogen Rates Have to Be To Maximize Economics? FieldCropNews.com. https://fieldcropnews.com/2022/04/how-perfect-do-my-corn-nitrogen-rates-have-to-be-to-maximize-economics/.
Rosser, B. 2022b. What Rate of Nitrogen Should I Be Applying on My Corn? FieldCropNews.com. https://fieldcropnews.com/2022/02/what-rate-of-nitrogen-should-i-be-applying-on-my-corn/.
Rosser, B. 2022c. What’s Your Number? A Simple 2-Rate Method of Estimating Optimum Corn Nitrogen Rates On-Farm (the Delta Yield Approach). FieldCropNews.com. https://fieldcropnews.com/2022/04/whats-your-number-a-simple-2-rate-method-of-estimating-optimum-corn-nitrogen-rates-on-farm-the-delta-yield-approach/.
Acknowledgements
Thanks to Ken Janovicek, University of Guelph for N response data, analysis and MERN equations and calculations.