
Simple Summary
- In a recent Ontario dataset of 15 N response curves, reducing N rates 20, 40 and 60 lb-N/ac from traditional optimum N rates (10-year average costs/prices) resulted in:
- average yield losses of 4, 9 and 16 bu/ac, respectively
- average net losses of $0, $11 and $37/ac, respectively, using what might represent 2022 costs/prices ($1.20/lb-N, $6.75/bu corn) at the time of writing
- Assuming N responses are relatively normal, N prices increasing more than corn prices would justify some reduction in N rates (~10-15 lb-N/ac for this dataset using above costs/prices)
- Yield and net loss reductions for reducing N rates can be relatively flat to start, but eventually increase exponentially
- Building a dataset of N responses on your own farm can build confidence for adjusting N rates
With supply chain disruptions and global events over the past year, one question floating around winter 2022 has been “if we aren’t 100% certain today that we can source all the nitrogen (N) fertilizer we normally would, what are the risks if we don’t apply our normal N program in corn?”.
If you are in the uncertainty camp, perhaps you are weighing whether:
- corn acres stay at original intentions, but under the risk of uncertain final N supply and rates
- corn acres are reduced as a hedge to ensure that acres planted will have relatively normal N supply and rates.
Yield Risks for Underapplying N
What are the risks for underapplying N? To provide some insight, I will use a 2011-2014 N response dataset from 15 trials conducted on-farm across parts of Southern Ontario by former OMAFRA corn specialist Greg Stewart.
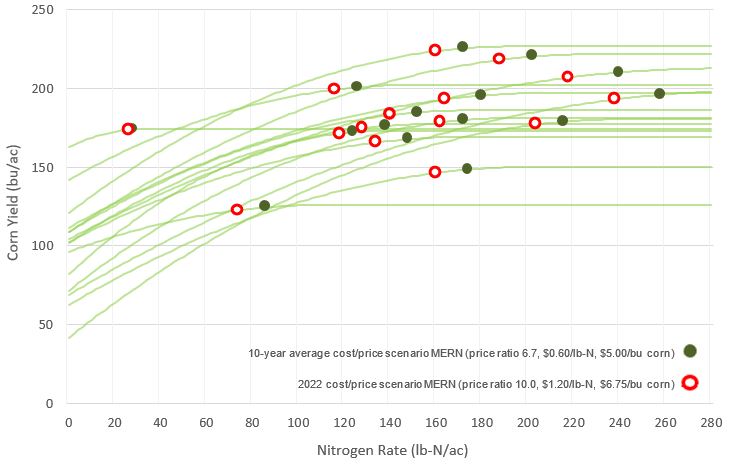
Figure 1. 15 corn N response curves with MERN for 10-year average and 2022 price scenarios from Southern Ontario, 2011-2014.
These N response curves (Fig. 1) include the Most Economic Rate of Nitrogen (MERN) for what might represent a:
- 10-year average cost/price scenario (green dot, $5.00/bu corn and $0.60/lb-N fertilizer)
- 2022 cost/price scenario (red circle, $6.75/bu corn and $1.20/lb-N fertilizer)
For more background on MERN, see the article “Understanding MERN (Most Economic Rate of Nitrogen) for Corn” (Rosser, 2022b).
Yield risks for underapplying N in this dataset can be made by comparing yield loss for these curves as N is shorted below MERN. Since most on-farm N rates are likely selected to not limit yields in most years, I will compare yield declines as N rates are shorted relative to the longer term 10-year average MERN (green dots).
Single Response Example
As an example of where we are going, Fig. 2 shows one N response curve from the above dataset. It is segmented into 20 lb-N/ac reductions below 10-year average MERN (green dot), with the corresponding amount of yield loss by each point. Reflecting the quadratic nature of yield response, we can see that yields decrease faster as N rates are reduced below MERN.
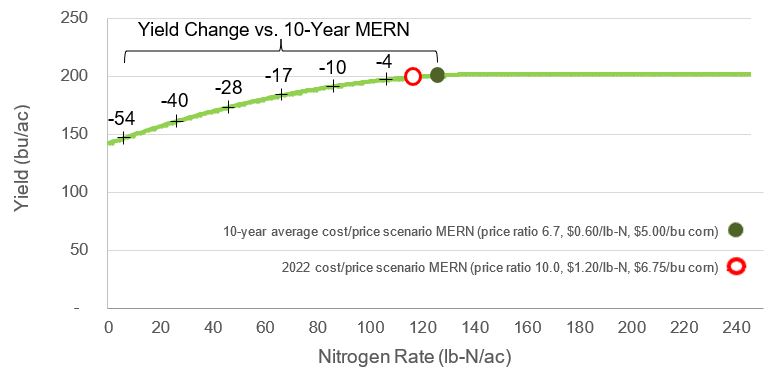
Figure 2. Quadratic-plateau yield response with 10-year average and 2022 cost/price scenario MERNs, and yield losses for reducing N rates relative to MERN for a corn nitrogen trial near Ilderton in 2012.
Full Dataset Analysis
Figure 3 graphs what yield losses look like as N rates are shorted below 10-year MERN for all 15 curves from above.
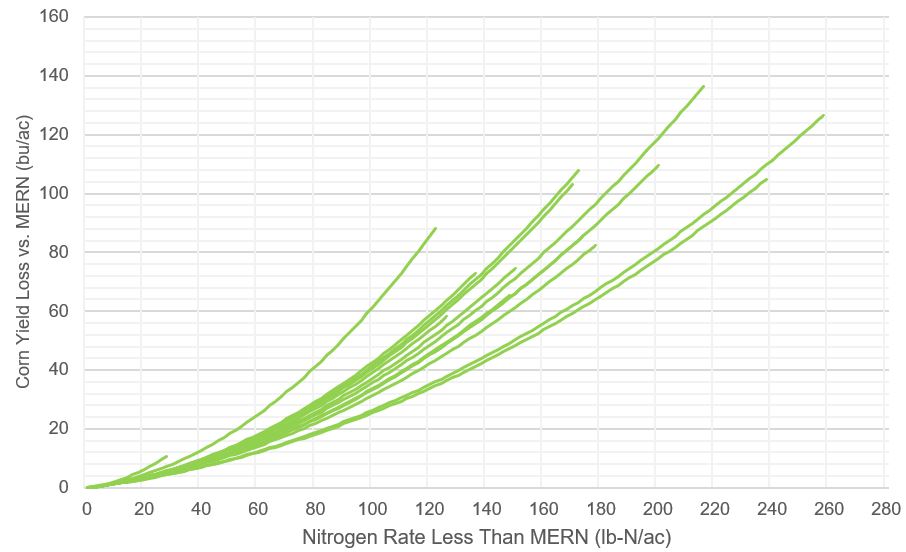
Figure 3. Corn yield loss for N rates less than MERN (10-year average cost/price scenario) for 15 Ontario N response curves.
This can help demonstrate what yield risks for underapplying N might look like, at least for this dataset. For example, as N rates are shorted from 10-year MERN by:
- 20 lb-N/ac, average yield loss is 4 bu/ac, with 13 of 15 curves losing less, and the greatest losing 6 bu/ac
- 40 lb-N/ac, average yield loss is 9 bu/ac, with 9 of 14 curves losing less, and the greatest losing 13 bu/ac
- 60 lb-N/ac, average yield loss is 16 bu/ac, with 8 of 14 curves losing less, and the greatest losing 25 bu/ac
- With the quadratic nature of yield response to N (Fig. 1), yield losses for the first increments of N below MERN can be relatively small but increase exponentially the more N is reduced
- Yield losses across the 15 curves are similar to begin with, but vary more as N is reduced, reflecting differences in shape of response curves
Economic Risks for Underapplying N
Yield losses are obviously important, but what really matters at the end of the day is economics. Figure 4 shows net return losses for the same curves by including the value of corn yield lost while removing the cost of nitrogen saved relative to 10-year MERN. Two sets of curves are included:
- green (dashed) curves showing net losses for what might be a 10-year average cost/price scenario ($5.00/bu corn, $0.60/lb-N)
- red (solid) curves showing net losses for what might be a current 2022 cost/price scenario ($6.75/bu corn, $1.20/lb-N)

Figure 4. Net losses for N rates less than MERN relative to 10-Year Average Price Scenario MERN for 15 N response curves in Ontario at both 10-year and 2022 cost/price scenarios.
Looking at the red (solid) curves (2022 cost/price scenario), as N rates are shorted from 10-year MERN by:
- 20 lb-N/ac, average net loss is $0/ac, with 11 of 15 curves losing less, and the greatest losing $18/ac
- 40 lb-N/ac, average net loss is $11/ac, with 8 of 14 curves losing less, and the greatest losing $38/ac
- 60 lb-N/ac, average net loss is $37/ac, with 8 of 14 curves losing less, and the greatest losing $96/ac
Like yield losses, there is minimal change in net losses for the first increments of N below MERN, but they eventually increase exponentially the more N is reduced.
Net Losses for 2022 vs 10-year Average Cost/Price Scenarios
You may notice that in this dataset we can reduce N rates 20 lb-N/ac from 10-year MERN and suffer no economic loss. Many of the 2022 (red) curves actually dip below zero losses (become net gains) for the first 20-25 lb-N reduction as cost savings in N are greater than the value of yield lost.
Because N costs have increased more than corn prices in the 2022 cost/price scenario, optimum N rates will be less than what they were using 10-year average costs/prices (as shown in Fig. 1). This is explained further in the article “How Low Should You Go? Adjusting Corn Nitrogen Rates for High Fertilizer Prices” (Rosser, 2022a).
As N-rate reductions continue, 2022 net losses eventually become greater than 10-year given the higher value of corn.
Parting Comments
When estimating risks for applying less N than normal, the last consideration should be “how close is my normal N rate to what is actually needed most years?”. The above loss examples are for N rates below MERN, not necessarily the actual rate being applied by the grower in each field. Of course, MERN is a bit of a moving target – it varies year-to-year and we don’t know exactly where it is going to be when applying N.
- If you are applying rates that might be well above a typical MERN, or not including N credits (manure, red clover, alfalfa etc.) where some are warranted, you may have more room before yield or economic losses apply.
- For example, if the normal N program in Fig. 2 was 160 lb-N/ac, there would have been 35 lb-N/ac of buffer even before reaching MERN.
- If you feel you are typically very close to MERN, perhaps the above values can serve as a general guide for risk.
One last consideration is if N responses (and MERN) end up being significantly greater than normal (N-losses, increased yield potential etc.) yield and net return losses could be greater than expected. Nothing beats good on-farm data to guide decision making. If you are looking for N rate guidance, or how to verify how close your N rates are to optimum on your own farm, see the article “What rate of nitrogen should I be applying on my corn?” (Rosser, 2022c).
Acknowledgements
Thanks to Greg Stewart, Agronomy Lead at Maizex Seeds for his comments and input on this topic and article.
References
Rosser, B. 2022a. How Low Should You Go? Adjusting Corn Nitrogen Rates for High Fertilizer Prices. FieldCropNews.com. https://fieldcropnews.com/2022/03/how-low-should-you-go-adjusting-corn-nitrogen-rates-for-high-fertilizer-prices/.
Rosser, B. 2022b. Understanding MERN (Most Economic Rate of Nitrogen) for Corn. FieldCropNews.com. https://fieldcropnews.com/2022/02/understanding-mern-most-economic-rate-of-nitrogen-for-corn/.
Rosser, B. 2022c. What Rate of Nitrogen Should I Be Applying on My Corn? FieldCropNews.com. https://fieldcropnews.com/2022/02/what-rate-of-nitrogen-should-i-be-applying-on-my-corn/.