Conditions
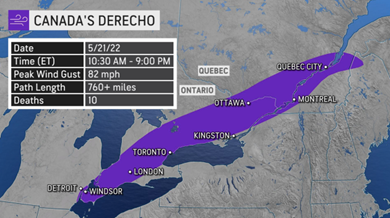
A large storm system with high winds, and variable amounts of rain on Saturday swept across Windsor to Quebec City, and left widespread power outages, downed trees, and property damage. The storm was classified by Environment Canada as a Derecho, (Figure 1.) which is defined as a line of intense, widespread and fast-moving windstorms and sometimes thunderstorms that move across a great distance. Rainfall ranged from a few to 15 mm with a few reports of hail. Field crops were not adversely affected, except where hail shredded leaves of cereal crops and where debris is scattered throughout fields, including metal and tree limbs in forage fields.
Cereals
Spring cereal acres are higher due to less acres of winter wheat planted last fall. Fields are planted and have emerged well with uniform stands. Frost-seeded cereals are well ahead of those planted in May.
Winter wheat fields continue to advance with earliest planted fields beginning to head. Disease pressure remains relatively low; however, some powdery mildew has been observed with a few varieties displaying higher pressure for powdery mildew. Fungicide application (T3) to prevent fusarium head blight (FHB) will begin as crops reach growth stage 58 to 61. The key to preventing FHB is to have fungicide products provide complete coverage to wheat heads. Heads that are missed or only partially sprayed (i.e. tillers only, missing upper leaves) are not protected.
FHB is impacted by wet, humid conditions with moderate temperatures and can result in shrunken kernels resulting in reduced yield and reduction in crop quality due to the presence of Deoxynivalenol (DON) in the grain. Fungicide application ideally occurs 2 days after 75 percent of the heads on the main stem are fully emerged (referred to as Day 0). This will be difficult in many fields where growth is variable (for example fields with tile-run growth). Application up to Day 8 will provide some visual control of fusarium and from observations often results in less DON relative to fields without fungicide
Forages
Forage harvest has started with forage rye harvest last week and early alfalfa-grass stands beginning the week of May 24th for dairy producers aiming for 4 cuts before September. Alfalfa in many fields has not yet reached bud stage. Orchard grass in alfalfa-grass mixes has headed. Alfalfa growth is variable, especially in fields with heavier soils that were impacted by prolonged wet roots last fall resulting in some winter damage. Growth ranges between 50 cm height for plants just approaching bud stage to plants with less than 20 cm of growth. This large range in maturity makes getting ideal feed quality difficult.
Alfalfa weevil is present in many fields which can result in reduced yield and forage quality. Typically, alfalfa weevil does not reach significant levels prior to first-cut, however, immediate harvest is not planned in many fields. Control may be required where insects have reached threshold levels – 40% leaf-tip feeding with 2 or 3 active weevils per stem and more than a week from preferred harvest date or if the crop is less than 40 cm tall. For more information on thresholds and control products refer to the OMAFRA Field Crop Protection Guide – Publication 812 controlling alfalfa weevil or the new Ontario Crop Protection Hub.

Manure application after forage harvest has been shown to improve yields and alfalfa quality, however it is important to apply manure as quickly after harvest as possible before regrowth occurs. Manure application on alfalfa regrowth damages the new stems and results in lower yield in the tracked areas of the field. Application rates should be set to apply no more than 50 lbs/ac as ammonium-N – which is usually around 3,500 – 4,000 imperial gallons/ac of dairy manure – to prevent leaf burn or salt injury. A manure analysis will provide the phosphorus and potassium that was applied. Potassium from manure applied on alfalfa does not usually supply what the crop removes.
Corn and Soybeans
Corn planting is generally complete except on some heavy soils. Earliest planted corn emerged and at 3 leaves (stage V2). With excellent conditions for germination and early growth it is surprising that some corkscrewed plants are being observed as well as some gaps in plant stands. While group 15 herbicides combined with cold conditions often contribute to these observations, one other theory this year is that fields were in good condition for planting, however, many fields had sections that were less ready, leading to surface compaction and/or sidewall compaction that could contribute to corkscrewing.
Soybean seeding is estimated at just under 50 percent planted although this varies by region. Earliest planted beans are at unifoliate (stage VC). Based on conditions to date, beans planted to date can expect maximum yield potential, however, yield potential starts to decrease as soybeans are planted into June.
Simple stand counts can be estimated as soybeans emerge by determining plants per square foot. Two plants per square foot is equivalent to about 90,000 plants/acre, and generally indicates an adequate stand. On heavy clay soils 3 plants per square foot would be preferred.
Weed Control
The application of herbicides continues as conditions allow and as growers try to keep pace with crop growth. With so much of the crop planted in a short timeframe some post emerge options are being considered where pre-emerge windows have closed. As fusarium head blight fungicide application approaches, a thorough cleanout of all sprayer components is critical, especially after herbicide applications. Any small amount of herbicide residue left in an end cap or section of plumbing can cause unwanted crop stress during a critical stage of development. An example is shown in Figure 3.

Perennial sow thistle is a difficult weed to control and is evident now in many corn fields. Control is best when herbicide is applied after the 8-leaf rosette stage, when sustenance from root reserves decreases. Waiting to apply herbicide at this stage is difficult when good control through the critical weed-free period is also important. Balancing between timing and frequency of herbicide applications and choosing products that won’t contribute to carryover restrictions is challenging and often results in suppressing growth for the season.
Weather Data – May 16 – 22, 2022
| Location | Year | Highest Temp (°C) | Lowest Temp (°C) | Rain (mm) | Rain (mm) April 1st | GDD 0C April 1st | GDD 5C April 1st | CHU May 1st |
| Harrow | 2022 | 26.9 | 7.5 | 25.3 | 137.3 | 535.1 | 307.5 | 370.1 |
| 2021 | 30.1 | 7.7 | 0.9 | 74.4 | 561.0 | 319.4 | 300.7 | |
| 10 YR Avg. (2011-20) | 21.9 | 8.7 | 16.5 | 156.7 | 526.7 | 269.1 | 329.0 | |
| Ridgetown | 2022 | 27.3 | 5.0 | 20.8 | 120.3 | 488.0 | 268.3 | 326.8 |
| 2021 | 30.4 | 6.2 | 0.0 | 63.8 | 512.8 | 279.7 | 285.4 | |
| 10 YR Avg. (2011-20) | 22.7 | 7.1 | 9.3 | 136.9 | 478.4 | 225.8 | 295.3 | |
| London | 2022 | 26.3 | 3.8 | 26.9 | 133.0 | 482.1 | 266.9 | 321.5 |
| 2021 | 29.8 | 6.1 | 1.4 | 81.8 | 508.1 | 279.3 | 260.3 | |
| 10 YR Avg. (2011-20) | 22.6 | 6.1 | 15.0 | 142.4 | 467.2 | 218.6 | 293.2 | |
| Brantford | 2022 | 26.5 | 2.5 | 22.3 | 120.8 | 477.9 | 257.0 | 301.1 |
| 2021 | 31.5 | 4.2 | 0.0 | 82.3 | 485.0 | 255.5 | 256.5 | |
| 10 YR Avg. (2011-20) | N/A | N/A | N/A | N/A | N/A | N/A | N/A | |
| Welland | 2022 | 27.2 | 3.6 | 32.8 | 111.8 | 514.6 | 284.4 | 327.5 |
| 2021 | 30.5 | 4.8 | 0.0 | 53.4 | 495.5 | 262.0 | 253.2 | |
| 10 YR Avg. (2011-20) | 21.9 | 5.7 | 13.2 | 156.9 | 472.4 | 222.7 | 292.9 | |
| Elora | 2022 | 26.3 | 1.6 | 17.8 | 82.4 | 437.9 | 229.6 | 281.9 |
| 2021 | 29.2 | 3.9 | 0.0 | 70.6 | 440.2 | 219.4 | 221.8 | |
| 10 YR Avg. (2011-20) | 21.6 | 4.0 | 17.3 | 149.3 | 390.7 | 155.1 | 234.1 | |
| Mount Forest | 2022 | 23.9 | 1.9 | 27.0 | 113.8 | 445.4 | 243.7 | 307.5 |
| 2021 | 29.2 | 5.7 | 1.8 | 73.9 | 448.2 | 230.8 | 226.3 | |
| 10 YR Avg. (2011-20) | 21.5 | 4.4 | 14.7 | 134.0 | 379.3 | 151.5 | 231.9 | |
| Peterborough | 2022 | 26.2 | 0.8 | 17.6 | 90.0 | 445.8 | 223.1 | 300.8 |
| 2021 | 30.9 | 2.4 | 0.0 | 77.9 | 446.7 | 215.4 | 236.6 | |
| 10 YR Avg. (2011-20) | 22.4 | 3.7 | 10.5 | 131.4 | 405.7 | 169.5 | 255.7 | |
| Kemptville | 2022 | 30.3 | 3.3 | 55.7 | 198.8 | 498.8 | 256.5 | 331.8 |
| 2021 | 32.1 | 6.4 | 0.0 | 78.7 | 528.3 | 291.0 | 272.3 | |
| 10 YR Avg. (2011-20) | 22.5 | 5.4 | 14.3 | 145.2 | 428.1 | 193.3 | 271.6 | |
| Earlton | 2022 | 21.8 | -0.9 | 19.5 | 84.9 | 352.4 | 178.9 | 289.8 |
| 2021 | 30.2 | 5.9 | 3.8 | 56.6 | 431.2 | 217.6 | 226.2 | |
| 10 YR Avg. (2011-20) | 20.8 | 2.4 | 14.7 | 107.8 | 246.2 | 94.5 | 185.1 | |
| Sudbury | 2022 | 23.2 | 0.9 | 23.8 | 107.2 | 360.6 | 178.1 | 273.5 |
| 2021 | 29.0 | 5.7 | 3.4 | 77.7 | 418.4 | 208.0 | 221.6 | |
| 10 YR Avg. (2011-20) | 21.8 | 3.2 | 12.4 | 133.3 | 281.9 | 107.5 | 187.3 | |
| Thunder Bay | 2022 | 19.8 | -1.0 | 7.4 | 261.5 | 226.5 | 80.7 | 157.4 |
| 2021 | 29.4 | 0.1 | 46.2 | 145.7 | 326.9 | 126.9 | 200.0 | |
| 10 YR Avg. (2011-20) | 18.7 | 0.0 | 25.0 | 97.1 | 227.7 | 64.1 | 152.5 | |
| Fort Frances | 2022 | 19.5 | -1.1 | 12.5 | 245.7 | 244.0 | 100.1 | 193.2 |
| 2021 | 28.9 | 6.8 | 14.5 | 107.1 | 363.8 | 159.9 | 269.3 | |
| 10 YR Avg. (2011-20) | 20.1 | 0.6 | 21.7 | 89.9 | 275.1 | 93.4 | 189.3 |